Bitcoin has given back some of its weekend gains, pulling back to the breakout level of $95,000. Buyers need to hold this level to maintain the bullish momentum. Bitcoin network economist Timothy Peterson said on X that Bitcoin could hit a new all-time high and reach $135,000 within the next 100 days if certain conditions are met.
Peterson believes that if the CBOE Volatility Index drops below 18, it could create a more risk-friendly market environment that supports Bitcoin. The other key factors for a Bitcoin rally are a drop in interest rates and solid performance during the top-performing months of June and July.
The crypto markets may remain unstable for a while as traders wait for the Federal Reserve’s interest rate decision next week. Although the CME Group’s FedWatch Tool suggests a low chance of a rate cut on May. 7, markets could react strongly after the event.
Bitcoin correction or continuation?
Can Bitcoin hold the $95,000 level if it gets retested? If so, let’s analyze the charts of other cryptocurrencies that could move higher in the near term. Bitcoin broke above the $95,000 resistance on May. 1, but the Bulls couldn’t maintain the momentum.
The price dropped from $97,895 on May. 2 and has returned to the $95,000 breakout level. The upward-sloping 20-day exponential moving average ($92,106) and the RSI in positive territory suggest that buyers have an edge.
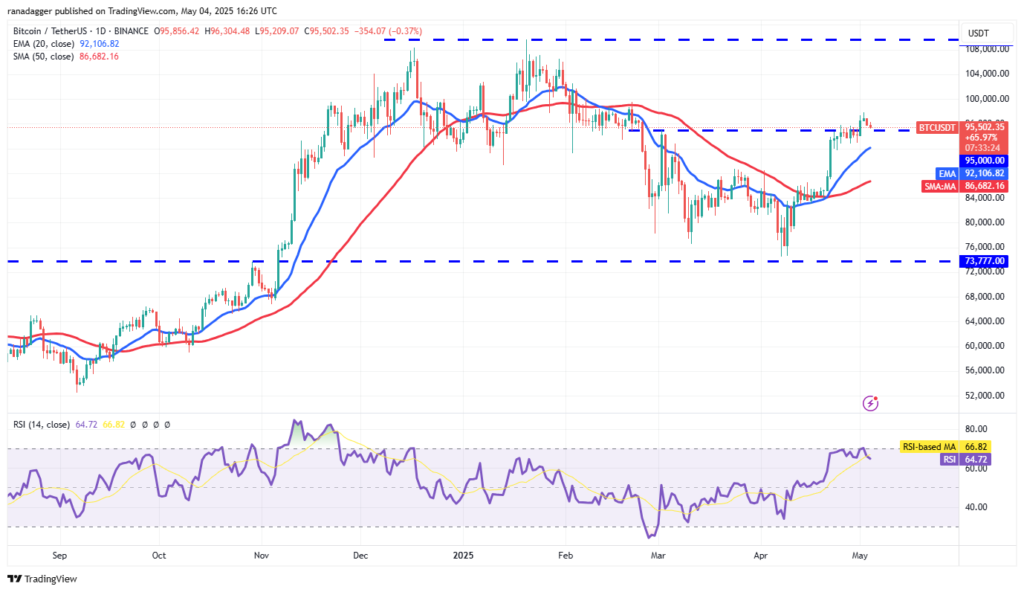
If the price bounces back from $95,000 and the 20-day EMA, the bulls will likely try again to drive the BTC/USDT pair up to $100,000.
Contrarily, if the price breaks below and stays under the 20-day EMA, it could signal that the rally above $95,000 was a bull trap. The signal would increase the risk of a drop to the 50-day simple moving average at $86,682.