
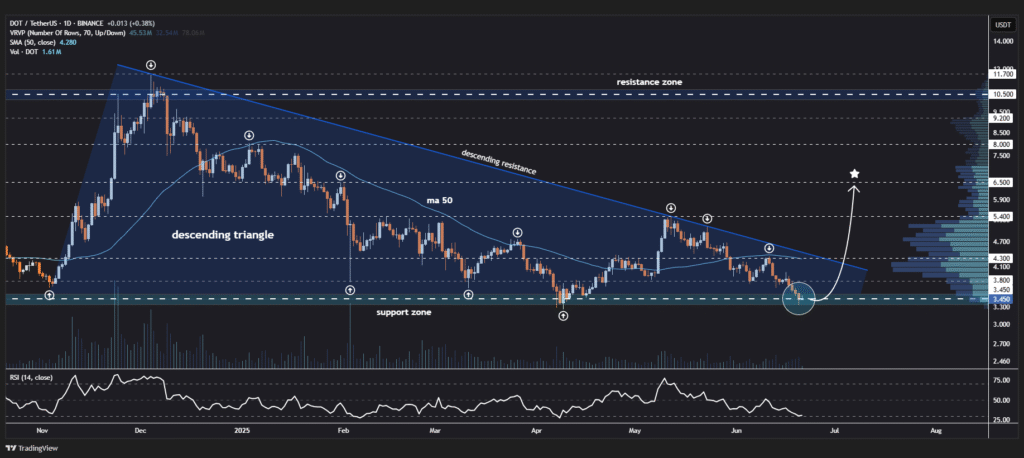
Polkadot (DOT) is exchanging at $3.28, 24-hour volume of $205.91 million and a market capitalization of $5.21 billion. The cryptocurrency remains near a critical technical level, forming a descending triangle formation on the daily time frame and testing a critical lower support region.
Analysts highlight the $2.50 to $2.80 price range as critical, with the potential for a significant market reaction. The daily bar chart displays a downtrending triangle pattern, with decreasing highs that are continuing to push the price toward flat support.
The lowest line of the triangle intersects with previous buying regions, where the price rebounded throughout the previous months. Bullish sentiment at $2.80 is showing signs that traders are preparing for another upside move should sentiment stay firm.
Around $2.50 support is a make-or-break level, aligned with some possible reversal zone. Above that, if volume surges confirm demand, DOT could aim for the $3.80 and $4.30 targets, considered here as short-term resistance.
More upside targets are at $5.40, which coincides with this year’s high, and at $6.50, which is a long-term resistance region that provides 150% profits from present levels.
Polkadot price outlook faces market pressure
JAM network enhancements and macro factors like inflows from Bitcoin ETFs may keep this optimism going. DOT has always gone up with improvements in the ecosystem, something that traders expect could be realized given current market conditions. However, even with the regular lower highs forming, this represents huge pressure by traders closing out on up movements.
A bearish scenario gathers pace if DOT declines below the support zone at $2.50 with rising trading volume. This might affirm sustained bear pressure, paving the way towards $2.00. A broader market pullback or descending Bitcoin momentum might additionally drive DOT towards the same level, destroying upside momentum.
Candlestick patterns, RSI, MACD, and level of volume will continue to be important signs. DOT’s future course hinges on whether the triangle support holds and verifies a breakout, which will determine if traders move toward accumulation or continue sell-offs.