Avalanche (AVAX) currently stands at about $16.86, which is a sideways movement in a narrow range on the 24-hour chart. Volume during writing was at $421.44 million, with its total market cap standing at $7.11 billion, which shows minimal activity by bulls and bears.
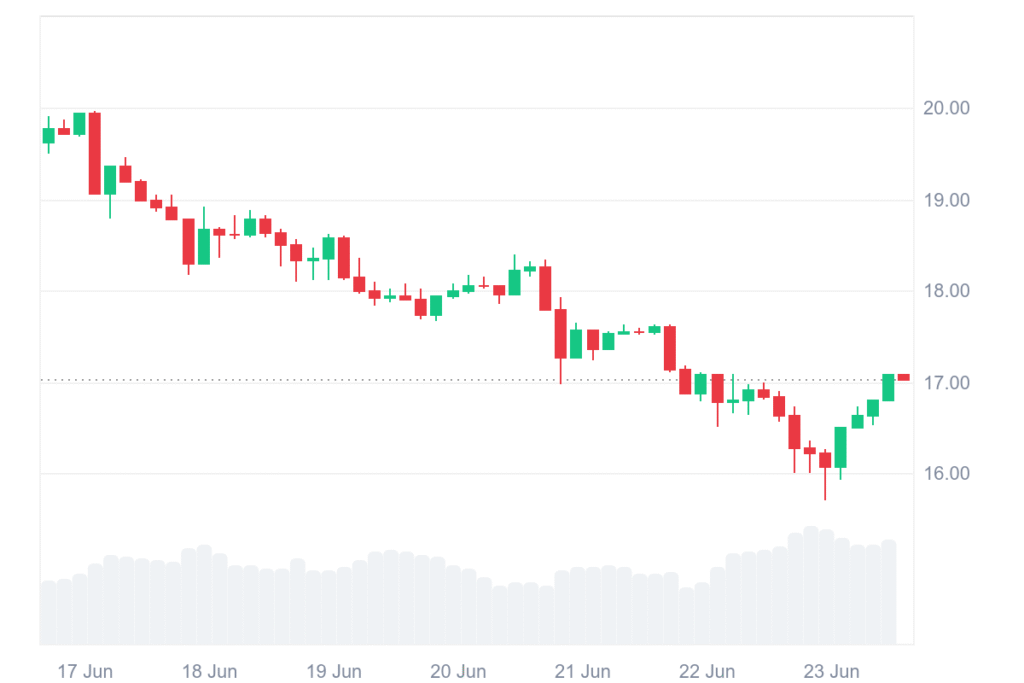
Price remains stable even against the selling pressures of the previous day witnessed across the broader crypto spectrum during the last few sessions.
On the weekly time frame, AVAX is again testing an important horizontal support level that coincides right along with a long-term declining trendline.
This technical region on several occasions in the past served as a price floor, thus a very important region for traders to watch. Should the coin manage to hold its ground here, analysts expect it could cause a significant bullish reversal from the present levels.
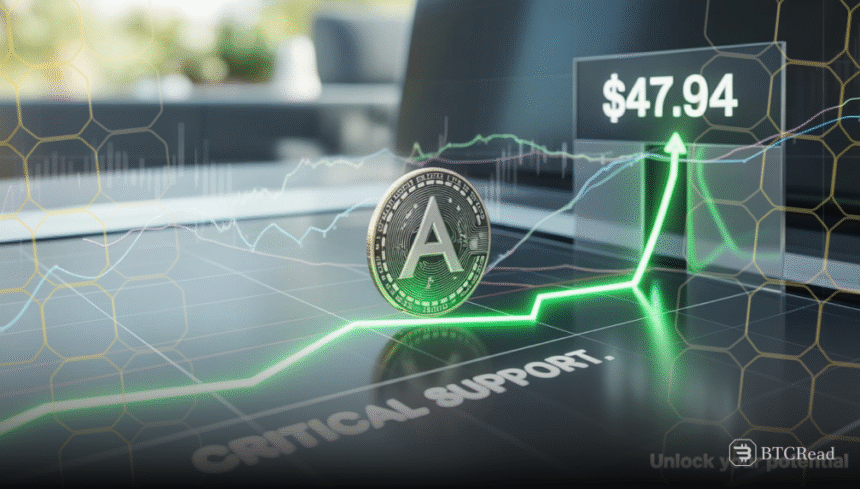
The chart, which BitMonty analyzed, indicates a potential upward trend for AVAX in case of maintaining the support level. Some of the targets for resistance on the chart were shown at $31.15, $38.70, and $47.94, which are points where price reactions might be witnessed.
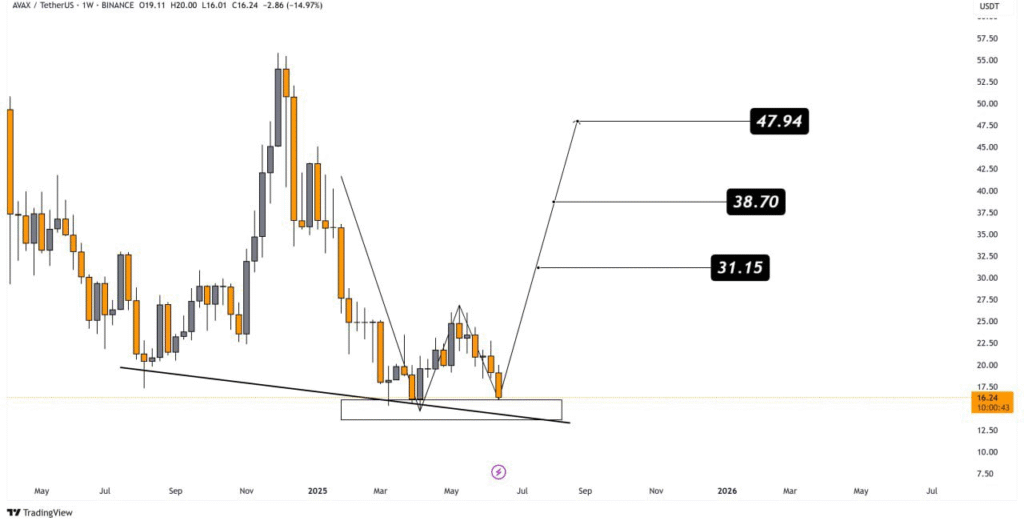
Avalanche weekly chart reveals bearish resistance zone
The current pattern on the weekly candlestick chart shows an earlier peak followed by steady decline, which matches the long-term downtrend line.
The confluence of horizontal and trendline support provides a technical case for possible price recovery. If volume increases at this level, it may confirm a bullish reversal setup.
However, traders remain cautious due to previous failed rebounds, especially the inability to sustain levels above $18.80, as seen in past sessions.
A drop through this region can produce drawn-out downside activity, which can bring about extra losses. Despite optimism, the technical pattern stays only 60% to 70% historically accurate, depending on big trends.
Traders need to examine Bitcoin and stock indices for directional clues, keeping a tight stop-loss near the zone of support.