
Shiba Inu (SHIB) has bounced above $0.00001324, giving bull hopes throughout the crypto market. Bullish signals are being displayed across the board, with various analysts aiming for $0.000018 as possible future regions provided current momentum holds through the next few weeks.
There is a double-bottom chart forming on the daily chart of SHIB, a bull reversal classic leading indicator. The setup often initiates a wave of higher highs, and the current structure supports a continuation of the uptrend if buyer interest remains consistent and volume steadily increases with each upward leg.
Breakout above $0.0000147 could trigger rally
The 200-day SMA at $0.0000147 is now the most critical resistance for SHIB. A breakout above this line could pave the way towards $0.000017, validating the double-bottom setup and clearing the way towards a possible 110% breakout towards $0.000029.
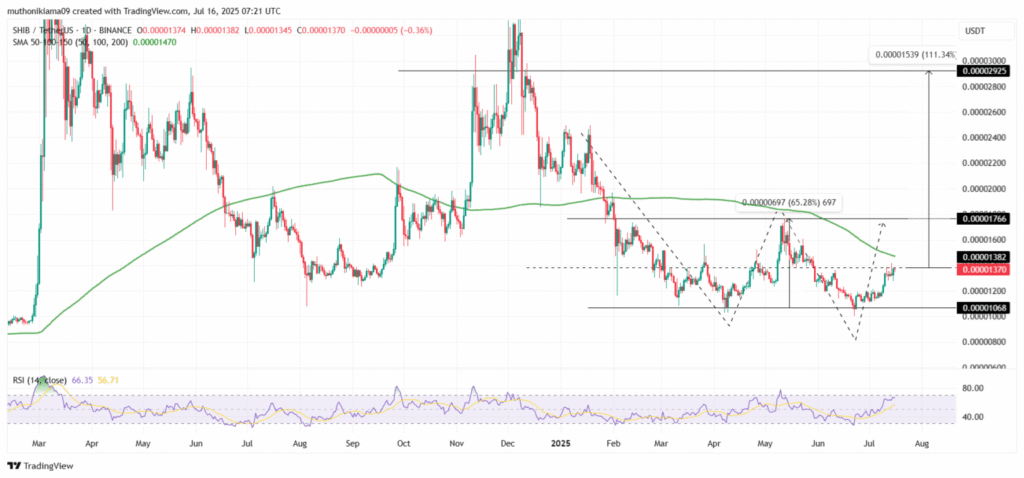
Moreover, this breakout requires the Relative Strength Index (RSI) to maintain its advance above the 50-mark and create new highs. Ongoing strength for the RSI confirms additional buying pressure, which is needed to push through resistance and repel bears.
Additional support for bull confidence, SHIB has produced a bull cross, when the 20-day EMA surges above the 50-day EMA. This occurred near $0.00001358, which was similar to May 2025’s equivalent setup, which powered a 34% rally from virtually identical price level.
Shiba Inu eyes $0.00001867 as next target
In May, a similar crossover near $0.00001320 preceded a sharp rally to $0.00001765. As the pattern re-emerged near the exact same price, the past could repeat if the buying pressure increases. These types of crossover occurrences frequently represent a sustainable uptrend in progress.
In the current market, SHIB is testing minor resistance at around $0.00001421 as per TradingView. If it breaches that level, it faces major supply at $0.00001468, $0.00001577, and $0.00001765. A break above these could engineer a 33–38% rally to around $0.00001809.
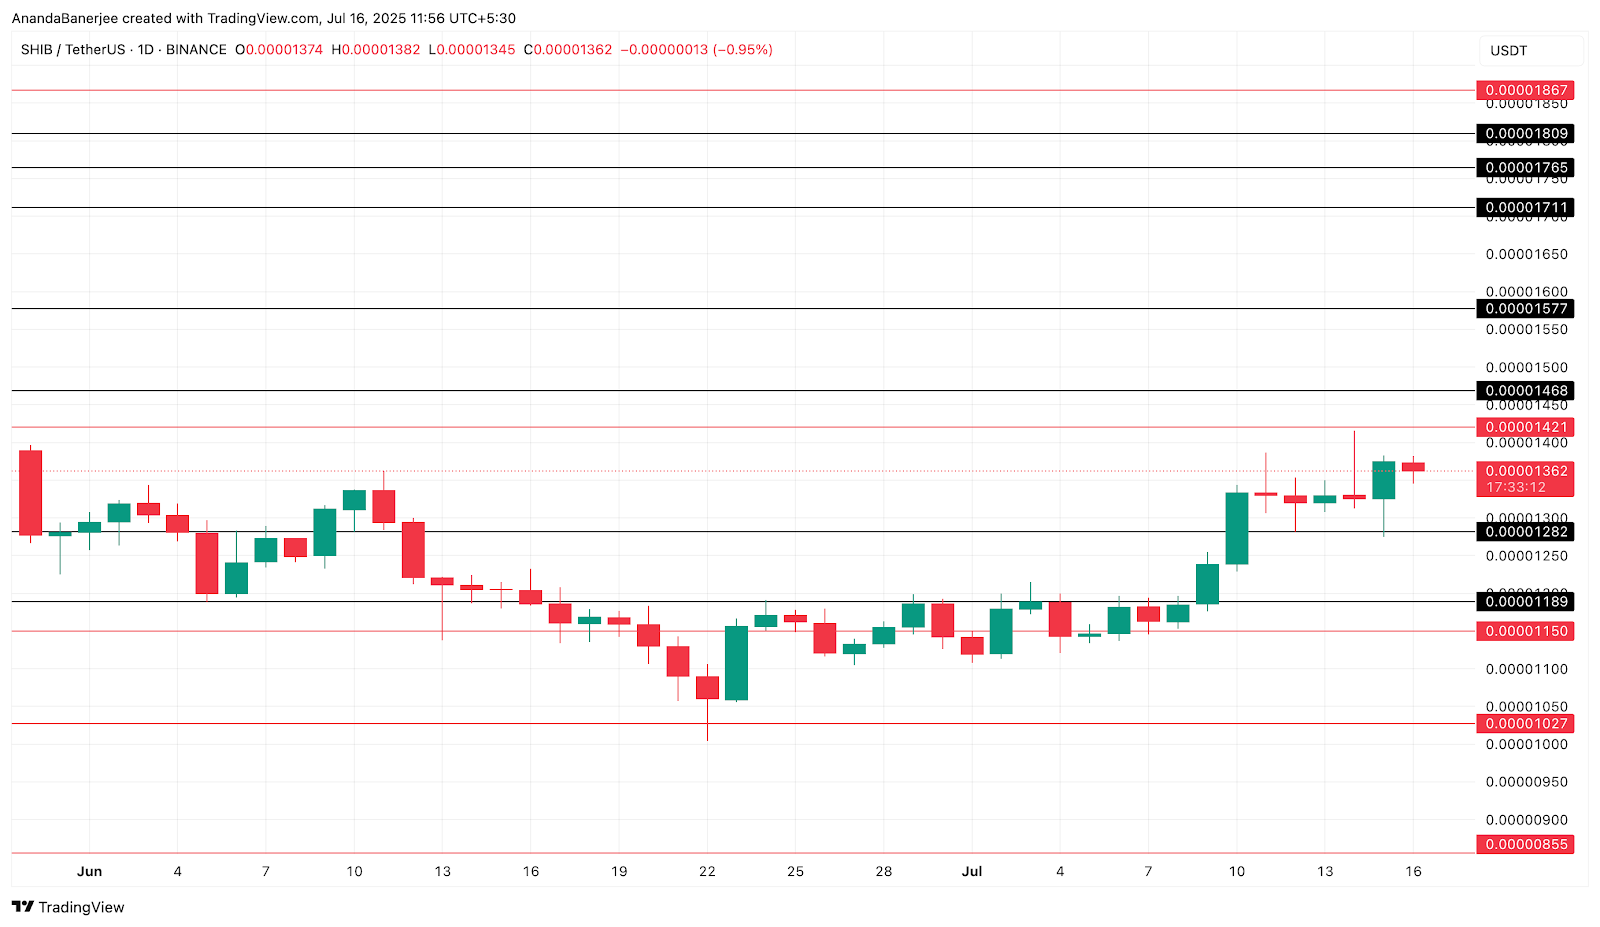
On the downside, immediate support remains at $0.00001320, the same point where the golden crossover flashed. Subsequently, critical levels are at $0.00001282, $0.00001189, and $0.00001150. If that slides below these levels, the bull case can be hurt and a larger correction can be triggered.