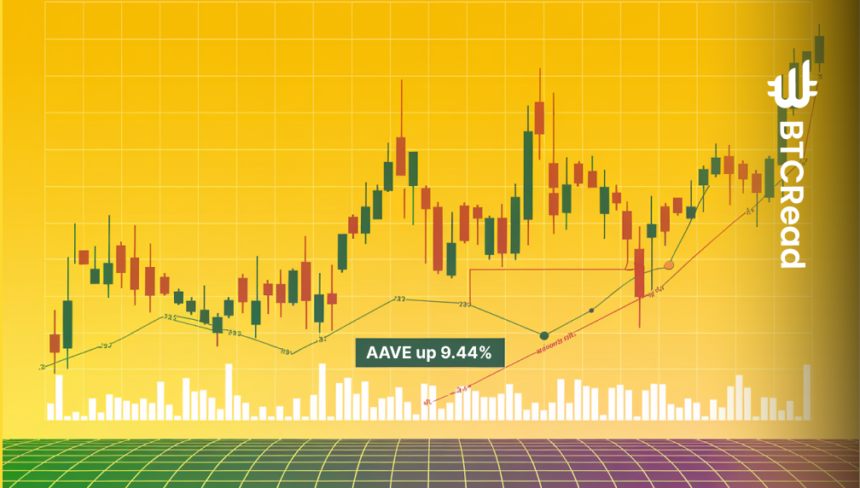
AAVE has shown strength over the last month, particularly in Dec. 2024, as it maintains an impressive upward price trend. This surge has caught the attention of analysts, with Viktor stating that AAVE’s bullish momentum is likely to continue.
According to Viktor’s analysis of the AAVE/USDT pair on Binance, the token experienced a price increase beginning around Dec. 4th, followed by a spike after Dec. 12th, signalling a potential breakout.
The price action suggests the cryptocurrency could enter a critical growth phase, with substantial buying activity fueling its upward movement.
However, AAVE’s price movements have shown classic signs of a bullish market phase. After a steady rise, the token’s price spiked around Dec. 12th, indicating that a breakout was underway.
The price action has been volatile, with fluctuations and smaller rallies leading up to the larger spike. This behaviour is typical during periods of accumulation, where investors position themselves in anticipation of further growth.
Adding to this sentiment, AMCrypto noted the strength of AAVE’s bullish trend, stating that AAVE is likely to see continued price growth as long as the current upward trajectory holds.
The analyst is certain that AAVE could reach a new all-time high (ATH) in the first quarter of 2025. Moreover, the token’s parabolic curve in its price chart suggests an exponential rise driven by increasing market enthusiasm and investor confidence.
AAVE’s price performance and market activity
As of press time, AAVE’s price had surged by 9.44%, reaching $338.89. Additionally, the token’s market capitalization has increased to $5.08 billion, reflecting strong market confidence. The trading volume surged by 40.99%, totaling $1.05 billion.
The recovery from a dip below $310 and the upward movement suggest strong investor optimism, positioning AAVE well for further price appreciation in the coming days.
According to technical indicators, AAVE‘s RSI stands at 56.79, indicating that the token is in a healthy bullish state, neither overbought nor oversold. This allows upward upward movement before reaching overbought conditions, typically above 70. Additionally, the RSI’s gradual movement toward the 60s supports the expectation of sustained bullish momentum.
Additionally, the MACD indicator also shows a positive trend, with the MACD line (blue) positioned above the signal line (orange), signalling that buying pressure remains strong.
This is evident in the MACD line having a value of 4.87, coupled with an assortment of green bars within the histogram that is ascending, which indicates a strong buy signal is unfolding.
Nonetheless, the negative value of the signal line indicates that selling pressure may be expected near the higher price levels like $350 which has been a level of resistance in the past.


