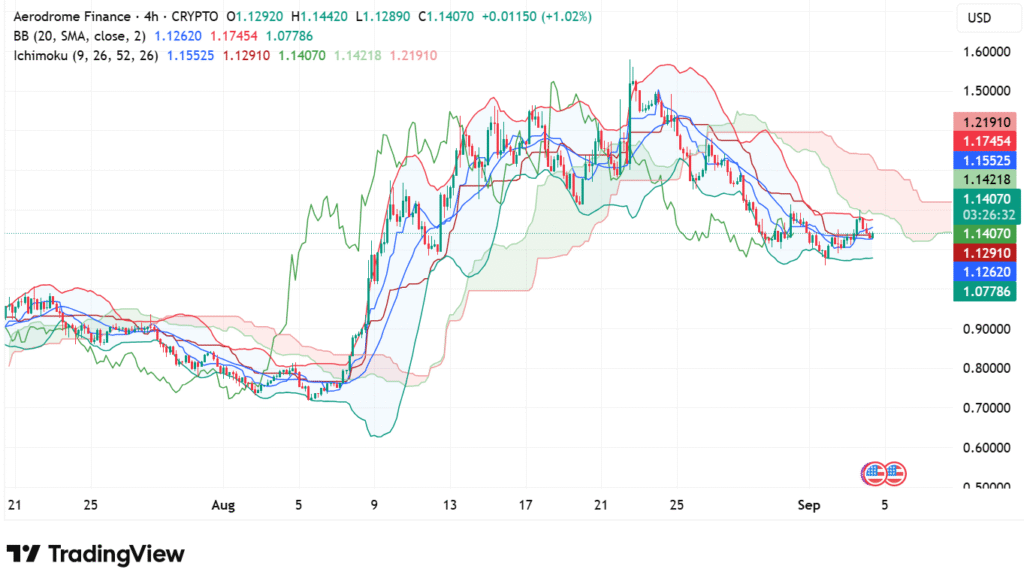
Aerodrome Finance (AERO) is at $1.14, just above the middle Bollinger Band on the charts at $1.1262. Tight bands imply reduced volatility, a departure from the high volatility swings shown earlier. The token is moving towards the top band at $1.1745, suggesting the buyers are testing strength but need a breakout to validate a larger upside movement.
The Ichimoku Cloud introduces additional complication. The conversion line on $1.1291 and the base line on $1.1421 put the token at a crossing point. Leading span A is nearby on $1.1407, but the stronger resistance is formed by span B on $1.2191. This puts the market in an exploratory situation on the edge of the cloud, indicating the possibility of a breakout but also the presence of resistance somewhere down the line.
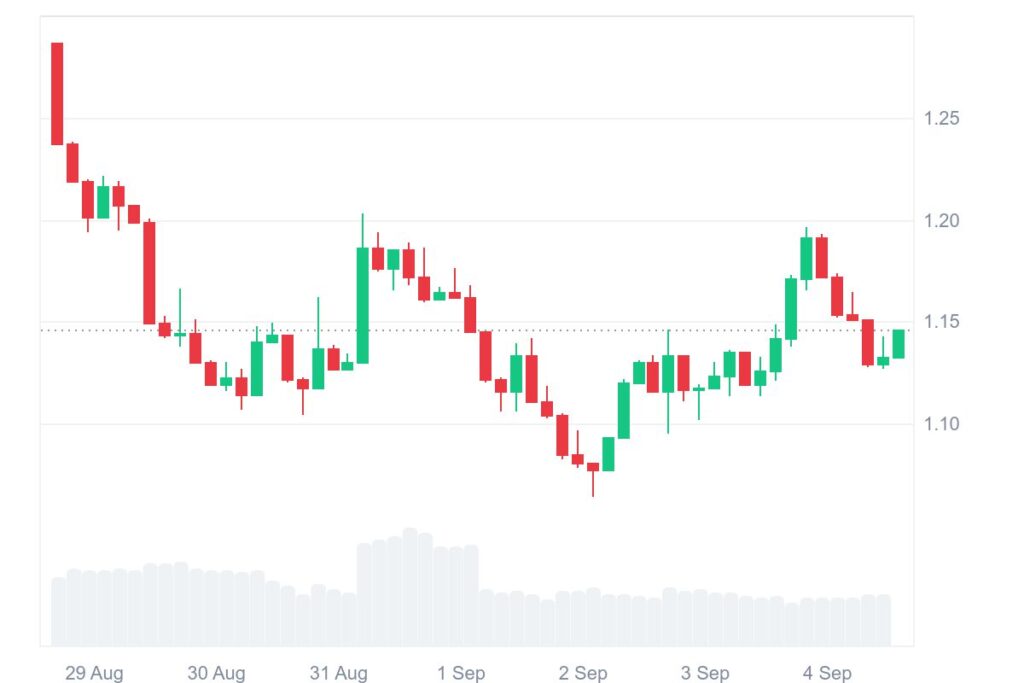
AERO support and resistance landscape
Market direction is still dictated by support and resistance. On the downside, the next support is at $1.12, on the middle Bollinger Band, with the next stop at $1.07, near the lower band. These are key points of defense for the buyers.
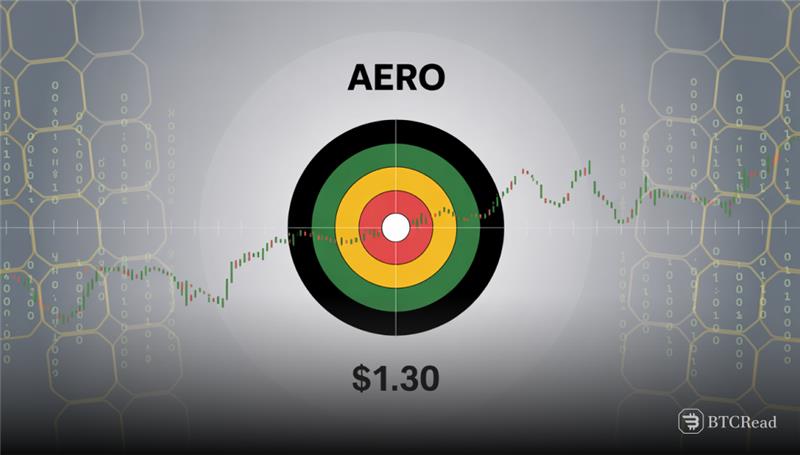
On the positive side, the initial resistance is at $1.17, with the next resistance at $1.22 where previous rallies have shown failures. If bulls manage to overcome these levels, an avenue to $1.30 may develop. Rejection at either would, however, tempt selling pressure again. Consolidation is the current situation for the token, with resilience at $1.14 providing the foundation for retrace attempts.
RSI and MACD indicators
Momentum indicators reveal improved market attitude insights. The RSI (14) stands at 48.76 with its signal line at 47.42. This neutral signal is slanted in the favor of the buyers as the indicator ascends. An increase above 55 would confirm increased bullish strength, but a drop below 45 puts bearish reversal on the horizon.
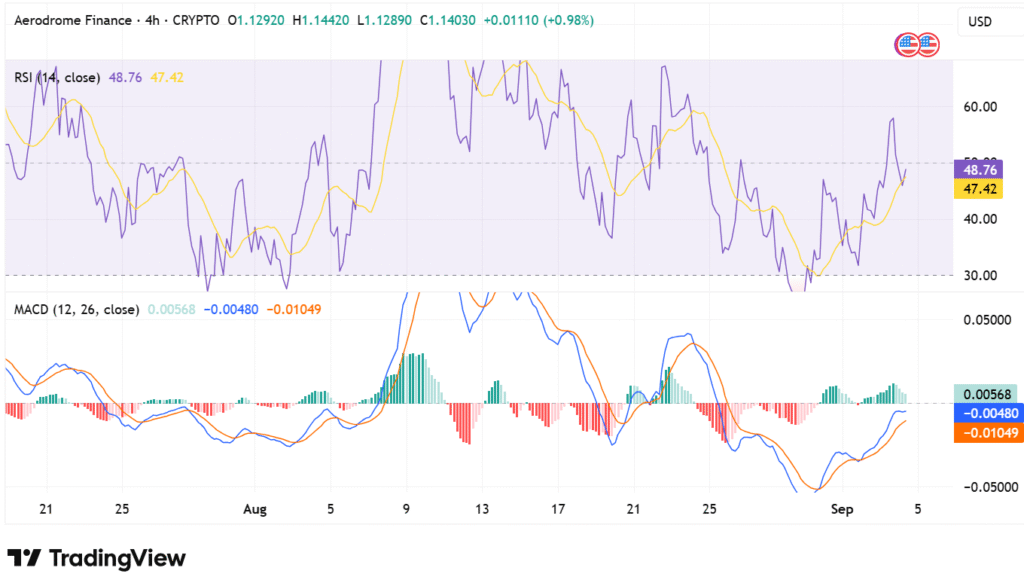
The MACD (12, 26, close) also supports cautious optimism. The MACD line at -0.00480 has moved above the signal line at -0.01049, with the histogram now also positive at 0.00568. This bullish crossover is an indication of better sentiment. However, the values are near the zero line, so momentum remains sluggish. Continued positive histogram will confirm the continuation of the strength, but fading indicators may reverse the market back into consolidation.