
Aptos (APT) is currently trading at $5.16 but boasts a daily volume of $248.15 million and a market cap of $3.39 billion. Its price is up 4.83% in the last 24 hours, as well as 15.78% in the last week.
The positive trajectory is a sign that investor sentiment is on the uptake and a higher number of people are purchasing in the crypto market.
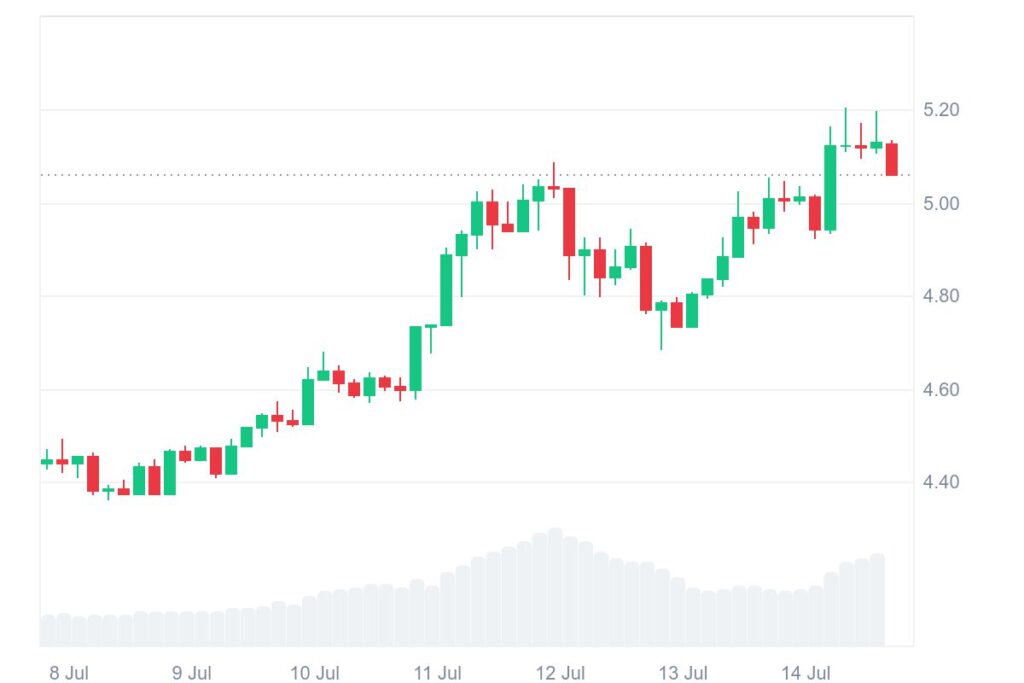
Today’s market sentiment is that Aptos is still stable in the area above the support zone at $4.50, registering buying pressure and strength in price. Cryptocurrency analyst Solberg Invest pointed out that $4.50 is a significant area where investors are entering and holding the price tight.
His chart shows that when Aptos goes on a rally through its current resistance area, the price would change to $17 to $18. If the rising momentum is even more robust, the final target would be achieving $30, which would translate to an increase in value upward of 500% from the current price.
The chart shared by Solberg Invest, called the “SAPT Macrochart,” shows Aptos’ price movement over the past few months. A green line marks the $4.50 level, which acts as support, meaning the price often rises from there. This shows many investors are buying around that price.
APT resistance breakout could trigger rally
A red diagonal or horizontal line shows resistance between $18 and $17, which is an area where, historically, sellers gain control. If Aptos goes through this resistance, then it is expected to keep building momentum on its way to the $30 target.
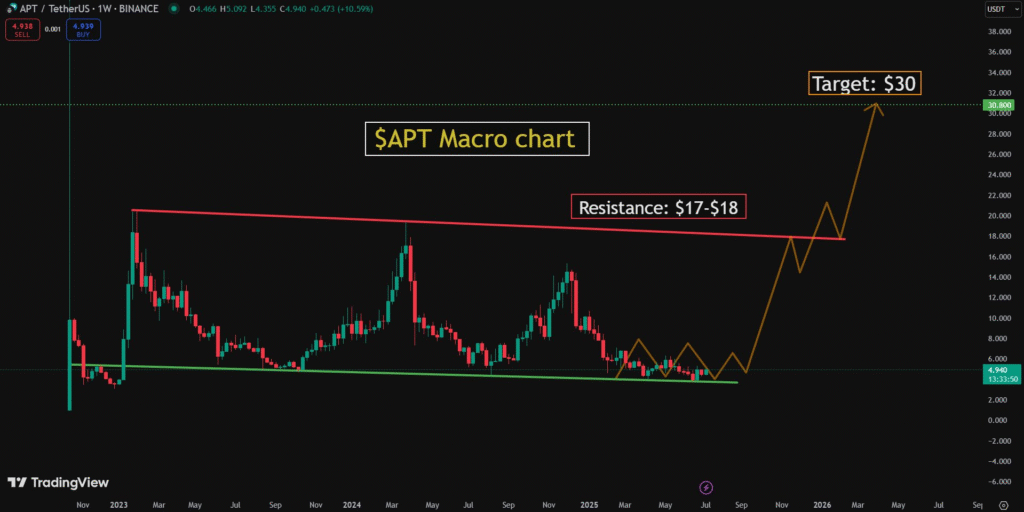
The ascending channel bottom is shown as a yellow rising line, which is likely a line connecting previous higher lows. The line shows an uptrend.
The candlestick chart exhibits high volatility, a sure indication of breakout formation patterns like flags or triangles. Such are normal formation indications for probable big bull breakouts.
The absence of technical indicators like RSI or even MACD puts the focus on old-fashioned methods like price action and trendlines.
Nonetheless, APT is trading at $4.94, very tight trading just above support. A breakout confirmed above $18, supported by rising volume, can take Aptos to the target of $30. Traders are watching closely, as failure to hold $4.50 can change the current market sentiment.