
Avalanche (AVAX) continues to show strength as it breaks out from a tight three-month trading range near $23.00. This breakout also ends a four-month downward trend, giving bullish traders renewed confidence in the current market direction.
AVAX now trades at $25.74, following consistent buying activity that pushed its price upward in recent days. Traders observed a high-profile Ichimoku cloud breakout and a bullish “katana” chart pattern, both of which signal additional upside.
So long as AVAX stays above support levels of $23.50 and $23.00, bulls control the near-term price action. Provided these levels continue to hold firm, analysts predict that AVAX is set to test higher resistance levels in subsequent sessions.
The chart shows good upside momentum beginning below $20.00 and steadily moving toward $26.00 with good green candlesticks and good volume.
Having reached a local high, the price fell into a sideways trend with consolidation and trader uncertainty. The recent breakout is indicative of the continuation of the trend, but the area of previous resistance near $26.36 is a level to continue watching.
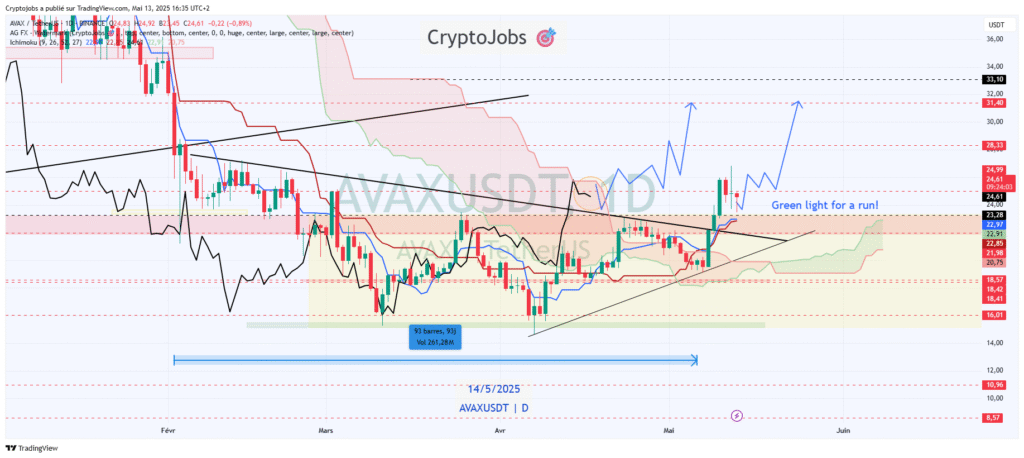
AVAX technical chart signals bullish continuation
Technical levels now indicate resistance points of $26.80, $28.30, and $31.20, with a potential further-term target of $35.20. MACD displays a marginal bullish crossover as RSI hovers around 60 levels, indicating stable momentum but diminishing vigor.
A clear breakout above $26.36 with increased volume could confirm bullish continuation toward those price targets. Analysts emphasize the importance of staying above $20.00 on weekly closing levels to maintain the bullish market structure.
Traders rotating profits into AVAX see this setup as favorable, with solid risk management and patience being critical during this phase. With volatility rising, AVAX may soon decide its next direction based on how it handles key resistance.