Avalanche (AVAX) has shown strong market performance recently, posting a 6.31% increase in its price over the past 24 hours, reaching $36.19. With a market capitalization of $14.88 billion, AVAX has demonstrated resilience and growth potential. AVAX appears poised for further upward movement as the token markets evolve, possibly targeting price levels from $80 up to $750.
AVAX’s price action has been positive in recent days. After a brief dip to $34.05, the token rebounded to around $36.20. This recent upward momentum aligns with technical predictions suggesting future price targets. These include $325.51 at the 1.272 Fibonacci extension and $490.17 at the 1.414 Fibonacci extension.

AVAX recently broke above the critical Fibonacci retracement level of $49.41. This is a key factor to consider, signaling the potential for continued upward movement. If this momentum persists, AVAX could reach even higher levels. Some targets could potentially go as high as $750 based on Fibonacci extensions.
Market dynamics and investor sentiment
The market dynamics for AVAX also reflect strong investor interest. The token’s fully diluted valuation stands at $25.9 billion, with a circulating supply of 411.32 million out of 449.66 million tokens. AVAX’s 24-hour trading volume of $431.01 million demonstrates solid liquidity, with the volume-to-market cap ratio at 2.88%.

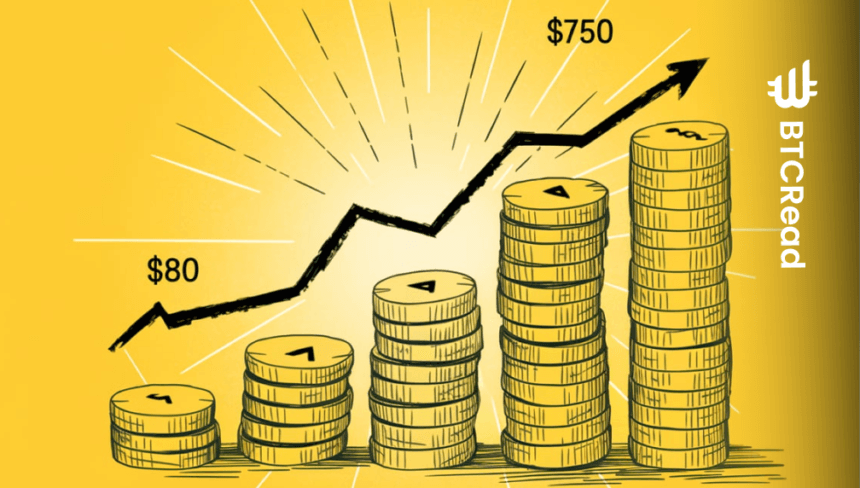
With strong technical indicators, solid market performance, and strong investor sentiment, AVAX seems poised for potential price targets in the range of $80 to $750. This depends on the continuation of bullish trends. However, market volatility remains a factor, and investors should be cautious as they watch for key support and resistance levels.
Technical indicators: A bullish outlook?
The technical indicators, the Relative Strength Index (RSI) and Moving Average Convergence Diverg (MACD) offer crucial insights into AVAX’s market sentiment.
The RSI currently sits at 49.27, indicating that the asset is in a neutral zone, neither overbought nor oversold. This balanced position suggests the market is still in a consolidation phase, with room for further growth if buying pressure increases. Should the RSI surpass 50, it could signal stronger upward momentum.

Another signal of the MACD histogram favoring the upward build-up also favors the bullish sentiment. The MACD line passed through 0.1557, while the signal line passed through -0.6107. This gave a positive divergence between the two lines, meaning that a bullish crossover may be in the offing to keep pushing the price. Further, the positive histogram supports this view, enhancing the probability of positive kicks that reflect an extension of the price spike.