
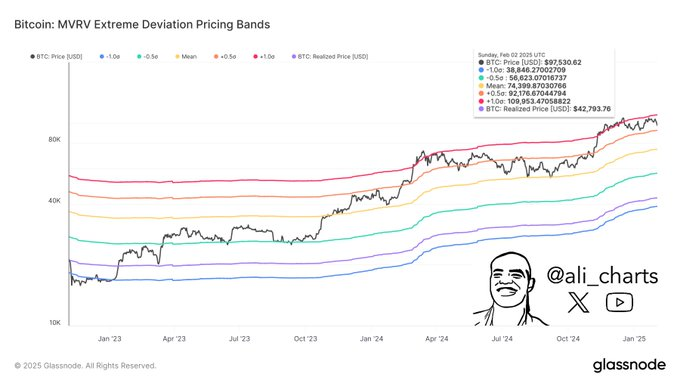
Bitcoin price movement is currently under close scrutiny, as recent technical indicators highlight crucial support levels and potential risks. As of the latest analysis, the $92,180 mark has emerged as a critical support level for Bitcoin (BTC). This is based on the Market-Value-to-Realized-Value (MVRV) Pricing Bands.
The MVRV Pricing Bands are valuable in understanding Bitcoin’s market cycle. The MVRV bands chart compares Bitcoin’s actual market price against its realized price, reflecting the price at which each Bitcoin was last moved.
These bands help gauge the extent of price deviation from the mean. They provide insight into whether Bitcoin is in an overbought or oversold condition.
Bitcoin’s price is moving into potentially overvalued territory, nearing the extreme deviation zone. The gap between Bitcoin’s market price and realized price has been widening, signaling that the asset is approaching a state of market overheating.
This suggests a possible price pullback, which could trigger if Bitcoin fails to hold the $92,180 support level. Should the price drop below this point, the next major target is $74,400, based on previous price action.
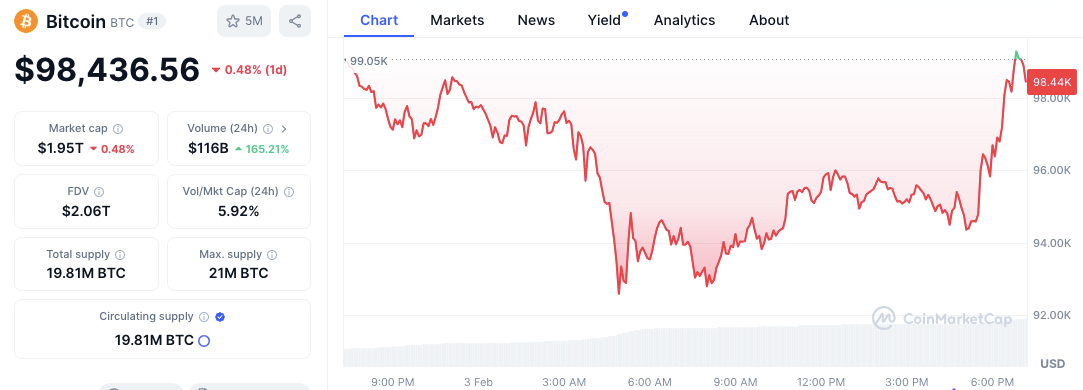
In terms of short-term price performance, Bitcoin is experiencing notable fluctuations. As of the most recent data, Bitcoin is priced at $98,436.56, down by 0.48% in the past 24 hours. The 24-hour volume has surged by 165.21%, reaching $116 billion, which indicates heightened trading activity and potential market volatility.
The increased volume suggests that traders are reacting to short-term price changes, contributing to Bitcoin’s recent upward spike after a period of decline.
MACD and Bollinger Bands signal bearish pressure
Technical indicators, including the Moving Average Convergence Divergence (MACD) and Bollinger Bands, provide further insights into Bitcoin’s market sentiment.
The MACD line is currently at -147.52, with the signal line at -1,571.88, indicating a bearish trend. The negative histogram value further supports this downward momentum, suggesting that Bitcoin may continue to face selling pressure in the near term.

Regarding the Bollinger Bands, which are related to volatility, there is an increase as well. It is oversold if it starts dropping to the lower band, and at the moment, the price is way below the middle band (SMA) of $100,090.84.


