
Bitcoin market momentum shows promising signs of a price surge, potentially pushing its value to $150,000 in the coming months. Analysts are observing a Re-Accumulation phase, similar to the one following Bitcoin’s previous halving events.
With Bitcoin’s historical tendency to experience a sharp breakout after such phases, the current conditions may signal an imminent +46% price rally.
A repeat of the post-halving re-accumulation?
Bitcoin is currently in a re-accumulation phase, which is when the market consolidates before the next major price breakout. This phase mirrors the post-halving re-accumulation Bitcoin experienced after past halving events, which led to a strong +46% price breakout. If history repeats itself, Bitcoin could break out of this consolidation phase and surge toward $150,000.
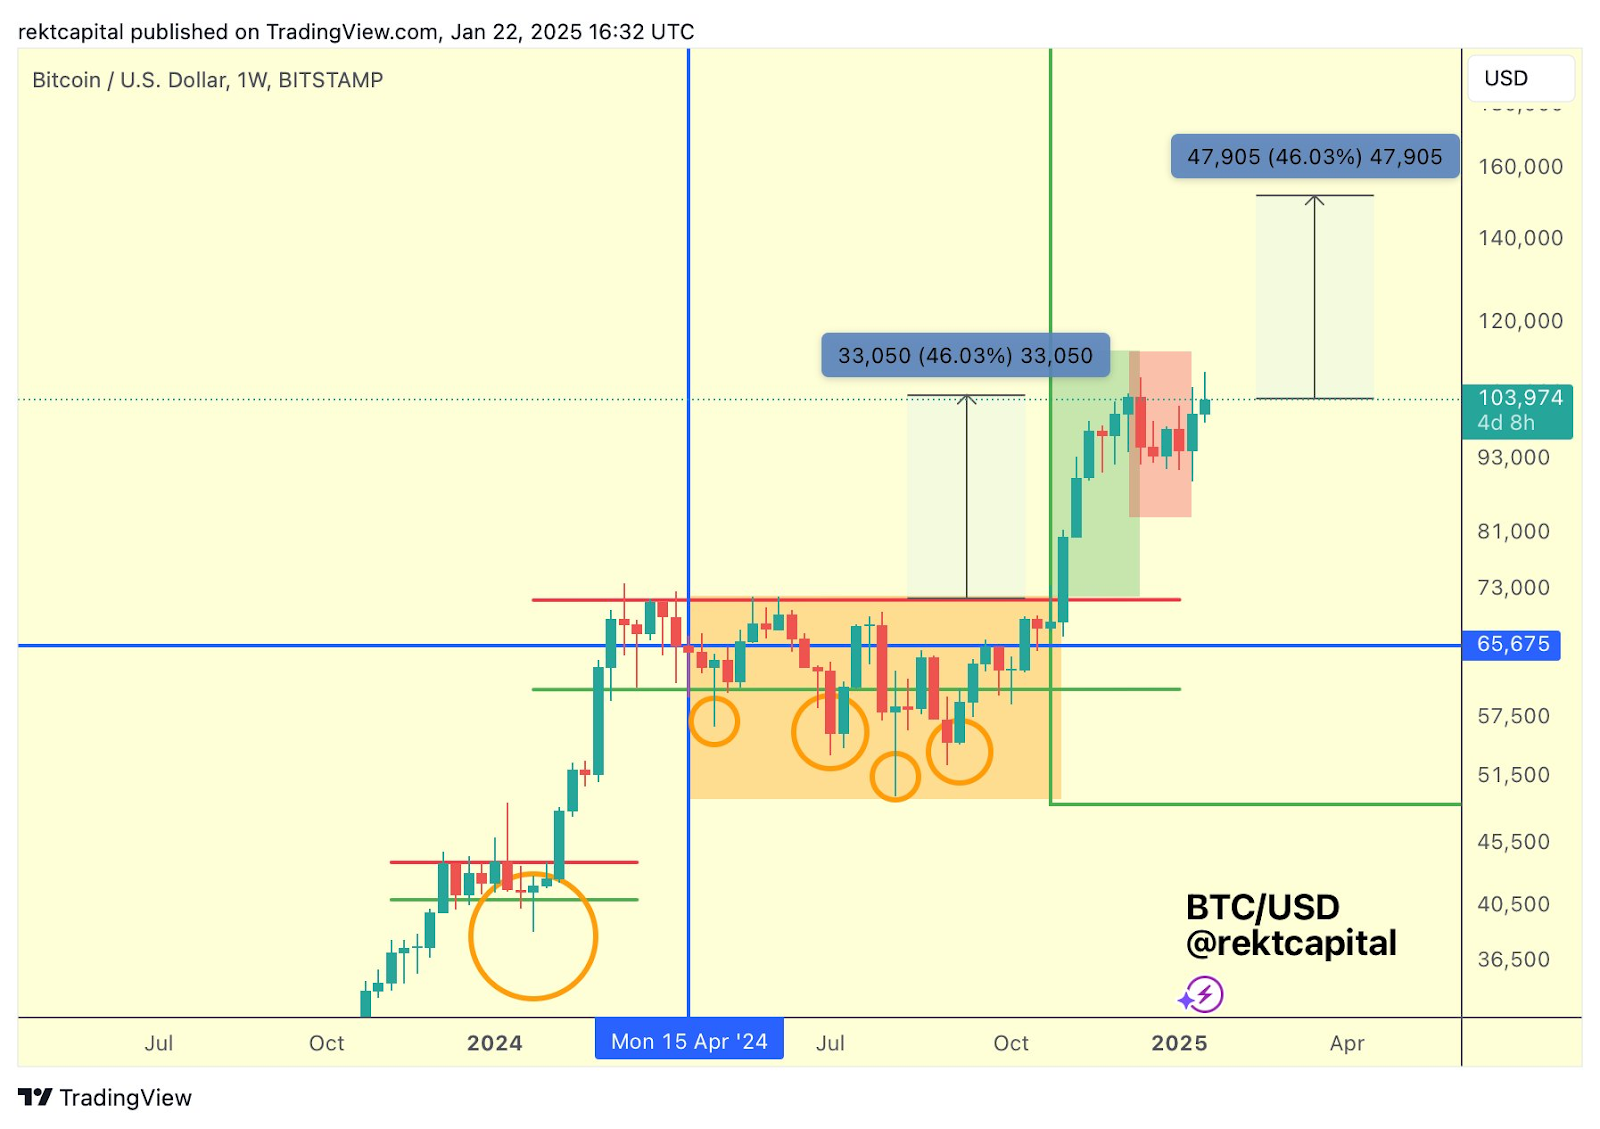
Key technical indicators suggest that a move towards $150,000 could be imminent. The 350×2 Pi Cycle MA, a critical moving average, is currently at around $140,000. Historically, Bitcoin has tended to overextend beyond this level during parabolic price movements.
The Pi Cycle top indicator and potential for parabolic growth
Bitcoin’s Pi Cycle Top Indicator has been an essential tool for predicting market peaks. This indicator tracks the relationship between the 350 DMA and the 111 DMA. The 350 DMA is currently at $140,711, while the 111 DMA sits at $86,673.
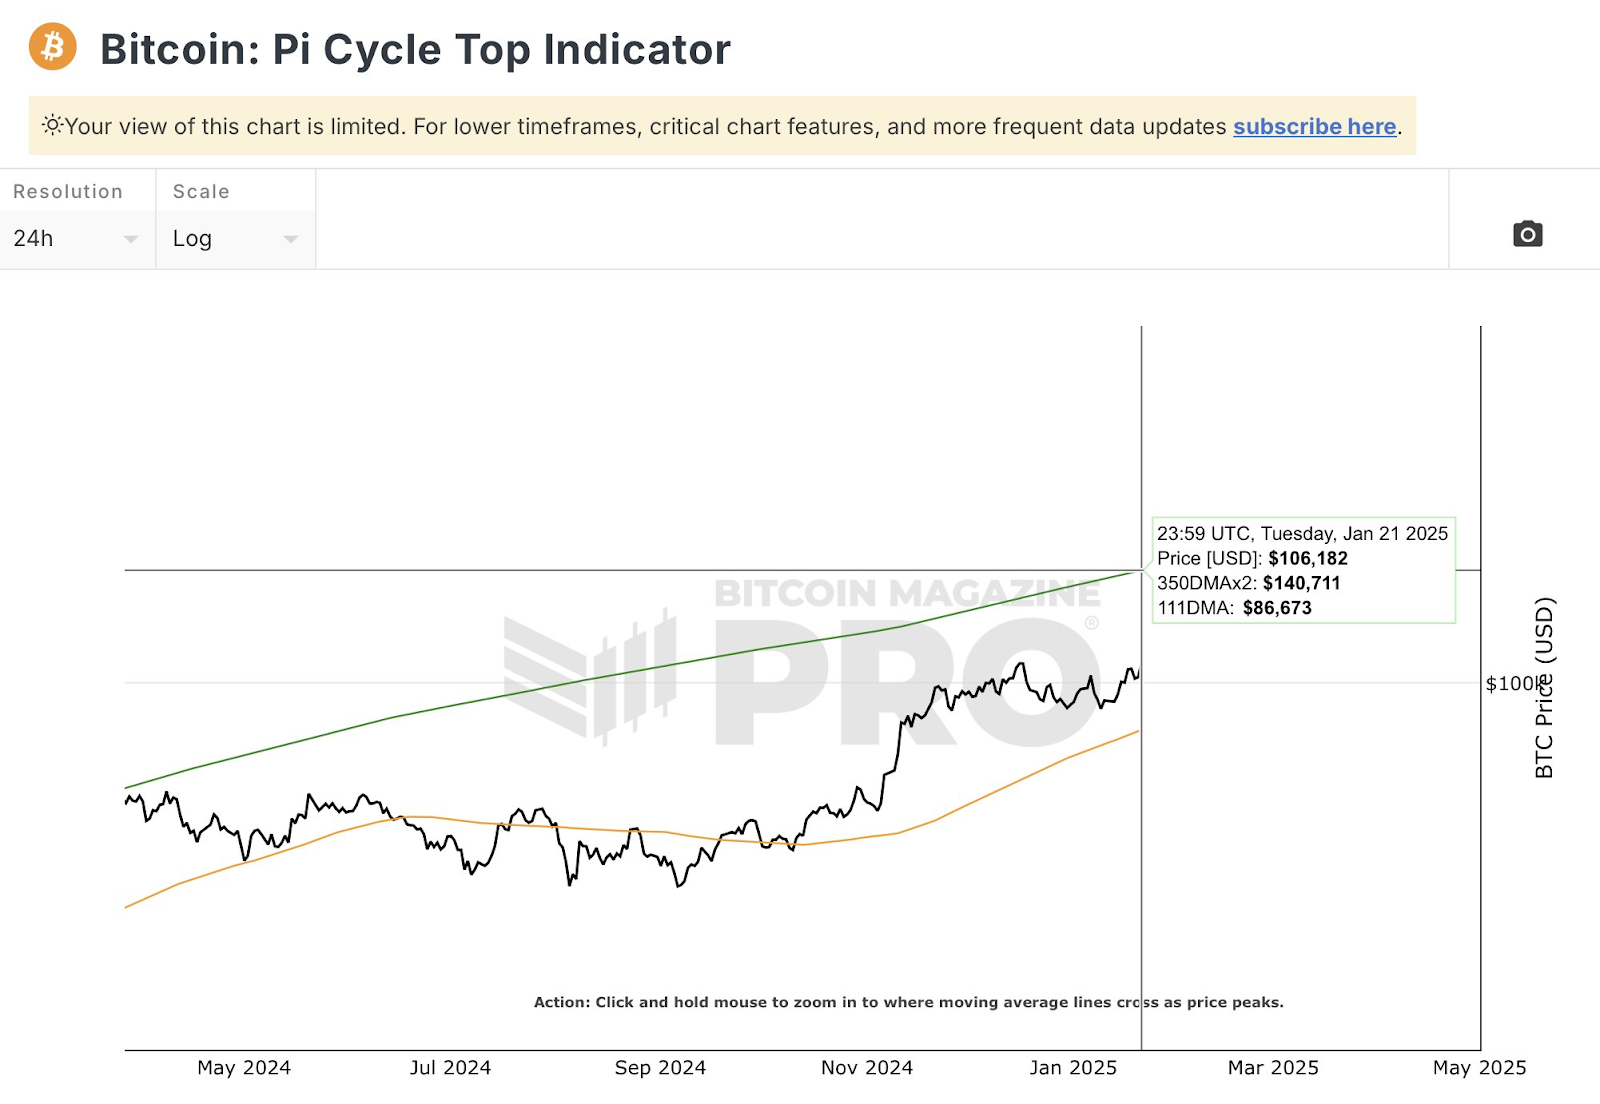
As Bitcoin approaches these moving averages, it is setting up for a price move. If Bitcoin continues the historical trend, a breakout beyond these levels could set a new price high, reaching the $150,000 mark or higher.
Given Bitcoin’s tendency to overshoot these indicators during periods of strong upward momentum, the Pi Cycle suggests the possibility of a further extension, surpassing the $140,000 threshold and continuing the parabolic rise.
MACD and RSI indicate short-term volatility
The MACD shows a bearish signal at present. The MACD line is currently at -97.87, below the signal line at -664.09, indicating ongoing downward momentum.
This negative divergence, accompanied by a histogram showing negative values, suggests that the market could experience further short-term pressure. However, such pullbacks are common during consolidation phases and can set the stage for a stronger rally once the downward momentum fades.
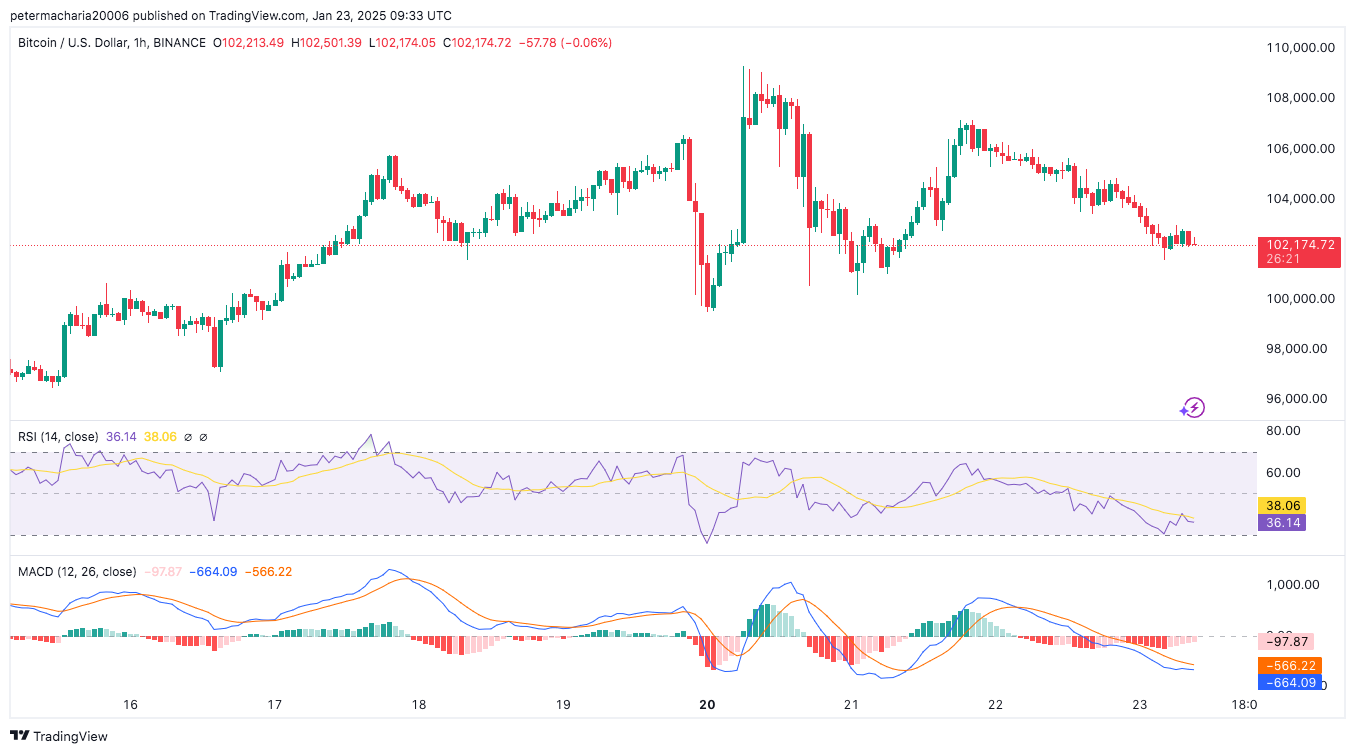
The RSI (Relative Strength Index) is also a key market sentiment indicator. Currently sitting at 36.14, Bitcoin’s RSI is just below the neutral 50-mark, which points to a potentially oversold condition.
According to market norms, a low RSI reading means Bitcoin may soon turn around. An upward trend in the RSI indicator will demonstrate an improvement in trader attitudes, which can mark the beginning of a market breakout.