Bitcoin has shown signs of a major bullish reversal, and its price could rise past $120K in the coming weeks and months. Bitcoin reached a low of $91K during the liquidation event on Feb. 2.
Since then, its price has started building momentum, suggesting that a strong upward trend is on the horizon. The technical indicators, including Elliott Wave analysis and Fibonacci retracements, suggest a potential price surge in the short term. Key levels also indicate substantial growth ahead.
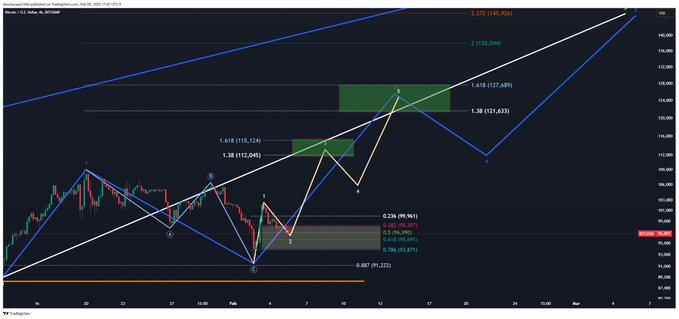
The recent price action of Bitcoin, trading just under $99K, shows a shift in market dynamics. After stabilizing from recent fluctuations, Bitcoin is approaching resistance levels, notably around the $100K mark.
This aligns with key Fibonacci retracement levels at 0.236, 0.382, and 0.887, which serve as potential buying zones. A breakout above these levels could propel Bitcoin toward the $115K-$120K range, with an optimistic scenario targeting $150K.
One aspect of Bitcoin’s recent performance is the correlation between its price movements and the increase in active addresses on the network. As Bitcoin’s price surged past the $60K mark in early 2024, active addresses reached new highs, peaking at over 1 million in early 2025.
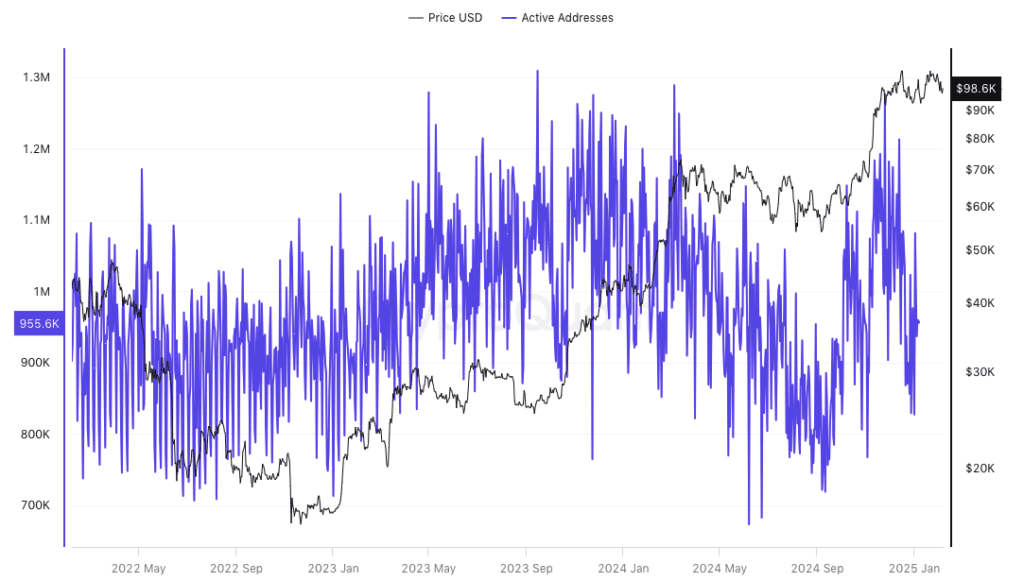
This rise in activity on social network is usually considered as the sign of higher utilisation of the product in the market meaning that more people are interacting with Bitcoin as the price goes up.
MACD and RSI indicate bullish momentum
Bitcoin’s technical indicators also signal further upside potential. The Moving Average Convergence Divergence (MACD) shows a strong bullish trend, with the MACD line above the signal line, supported by positive histogram bars.
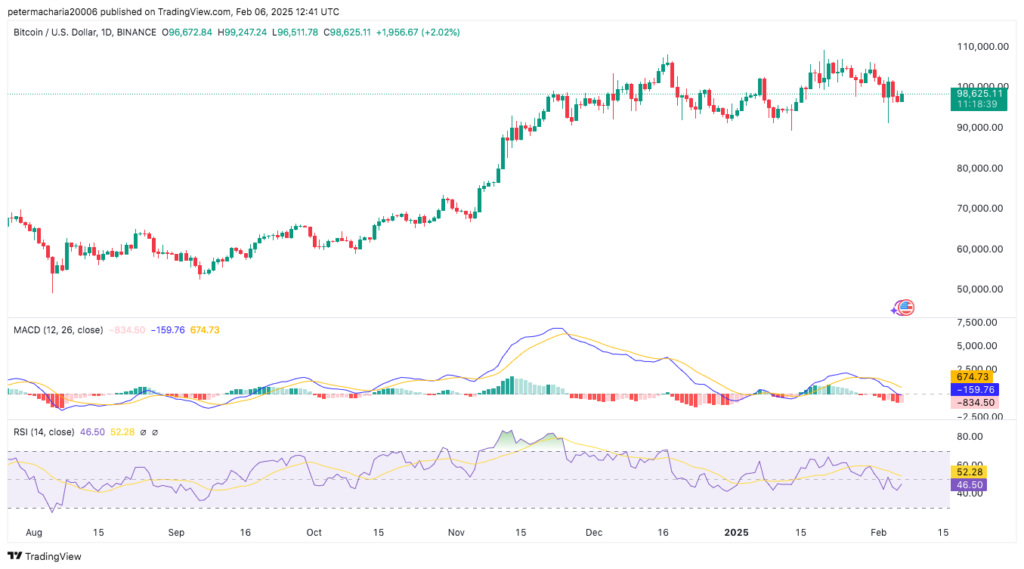
This supports the notion that short-term price direction is positive and it may rise soon to $320. The Relative strength index having a value of 52.28 indicates that the market is not oversold or overbought. While still not yet in the overbought range, RSI moved up, which also imply s an increase in the bullish sentiments.