Cardano (ADA) has been stuck within a symmetrical triangle since early Dec. 2024, setting the stage for a possible 40% price swing as it approaches the pattern’s apex in late January 2025. Traders often view symmetrical triangles as transitional zones where prices converge before a decisive breakout.

In ADA’s case, attention has centered on the tight range between the $0.69 and $1.35 marks, suggesting that a move may be imminent once the current consolidation phase concludes.
Cardano $ ADA’s recent market activity
On Jan. 24, 2025, Cardano registered a 7.29% price decrease over 24 hours, bringing its value down to approximately $0.9198. This decline followed a peak of $0.9922, after which consistent selling pressure dragged the price below $0.90. A partial recovery saw the token hover near its current level.
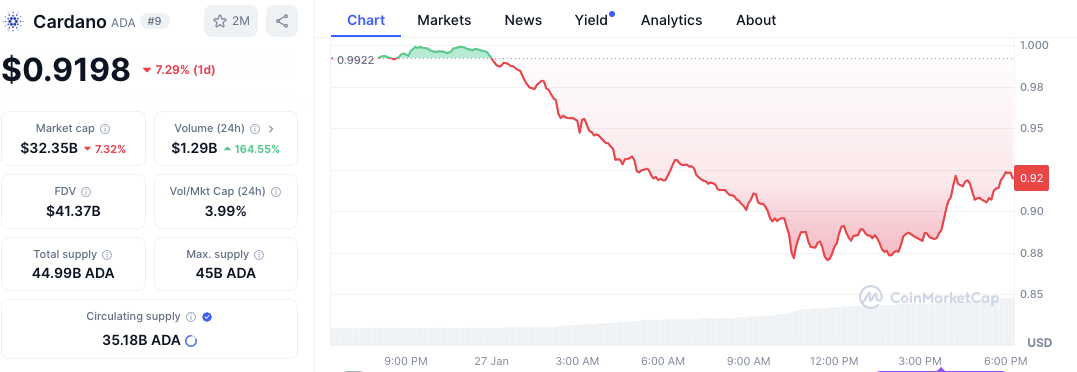
The market capitalization stood at $32.35 billion during the same time frame, while the fully diluted valuation reached $41.37 billion. Trading activity surged, with a 24-hour volume of $1.29 billion, reflecting a 164.55% increase and yielding a volume-to-market cap ratio of 3.99%. The circulating supply remained at 35.18 billion ADA tokens out of a total supply of 44.99 billion.
Support and resistance levels
The levels of support that participants have found in the market include $0.90, which has been tested through the current price fluctuations. On the opposite, $1.10 has formed a bold resistance level.
A sustained move above that threshold might indicate increased bullish activity. However, failure to hold above support could trigger a retest of lower price points, such as $0.85.
Technical indicators: MACD and RSI
The MACD shows a bearish crossover, with the MACD line at -0.013 dropping below the signal line at -0.006. This event typically signals heightened selling momentum.
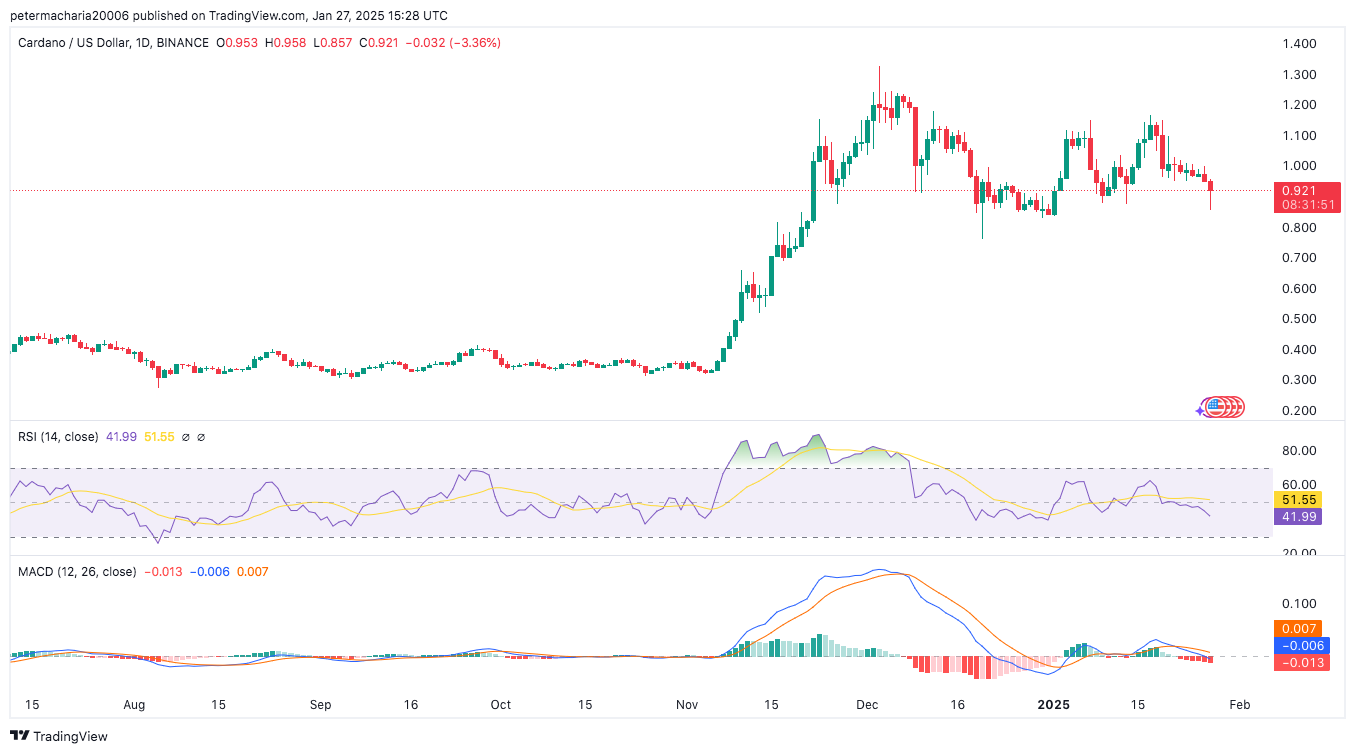
The histogram that shows the difference between MACD and the signal line indicates an increase in the negative bars. At the same time, the Relative Strength Index (RSI) was at 41.99 and more interpreted as the neutral-oversold region. While it is still slightly above this level, there is a clear sign of lessening buying pressure, which has pulled it slightly above the oversold range of below 30.


