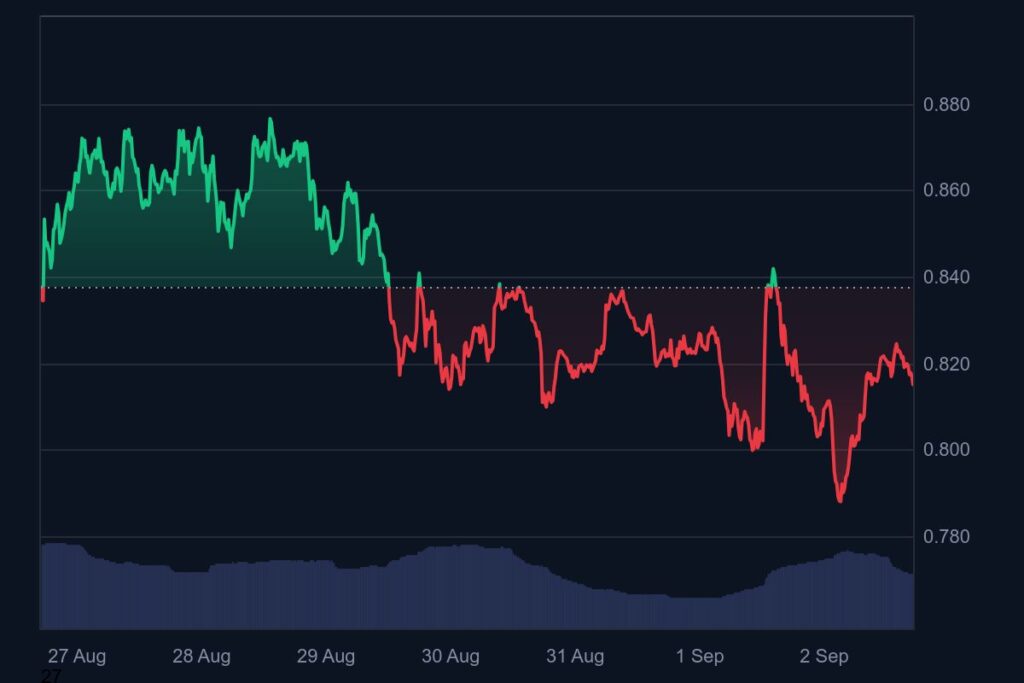
Cardano (ADA) continues to struggle under sustained pressure, reflecting the cautious sentiment across the broader crypto market. Over the past 24 hours, ADA has slipped by almost 1.31%, extending its weekly decline to 2.05%.
At the time of writing, the token trades at $0.8200, supported by a significant 24-hour trading volume of $1.34 billion, marking a sharp 33.18% increase. Its market capitalization stands at $29.3 billion.
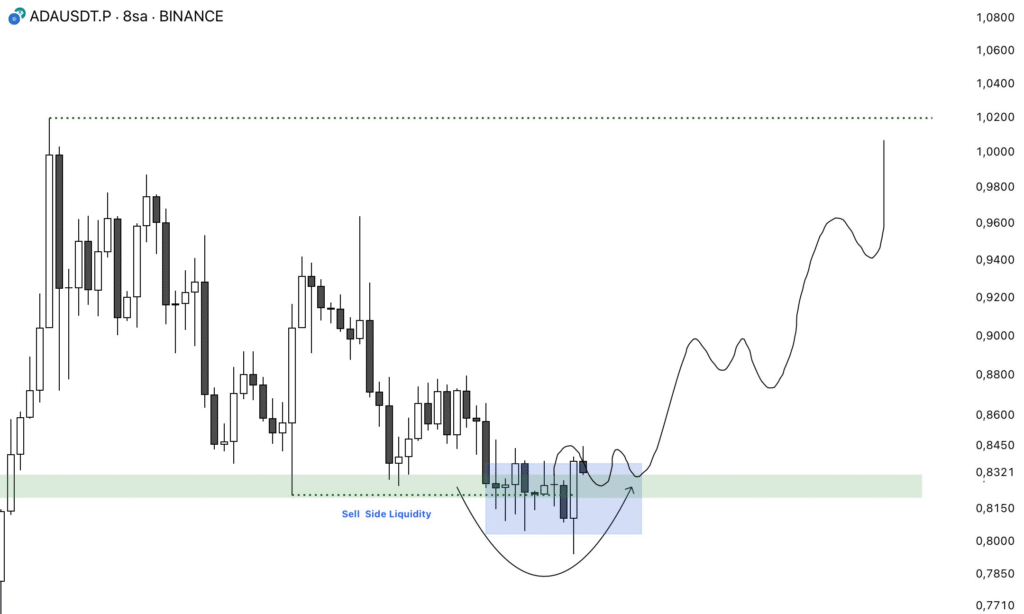
Market data reveals notable activity from large investors. In the past week, whales unloaded around 30 million ADA tokens, valued near $25 million. Despite this selling pressure, the ADA/USDT chart highlights a key liquidity zone between $0.8150 and $0.8320.
Price briefly dipped into this range, triggering stop-hunts on long positions before rebounding. This zone has since developed into a firm support base, indicating buyers are actively defending it.
Cardano technical signals suggest rebound
Cardano’s recent chart structure shows signs of strength building at current levels. The price pattern resembles a rounded bottom, often signaling a recovery path. Analysts suggest that holding above the $0.8150–$0.8320 range increases the likelihood of gradual upward continuation with minor pullbacks.
A breakout becomes more likely if ADA closes above $0.8450–$0.8600. Such a move would shift momentum from consolidation to bullish territory. A push past $0.8800 could accelerate gains, with short-term resistance at $0.9000.
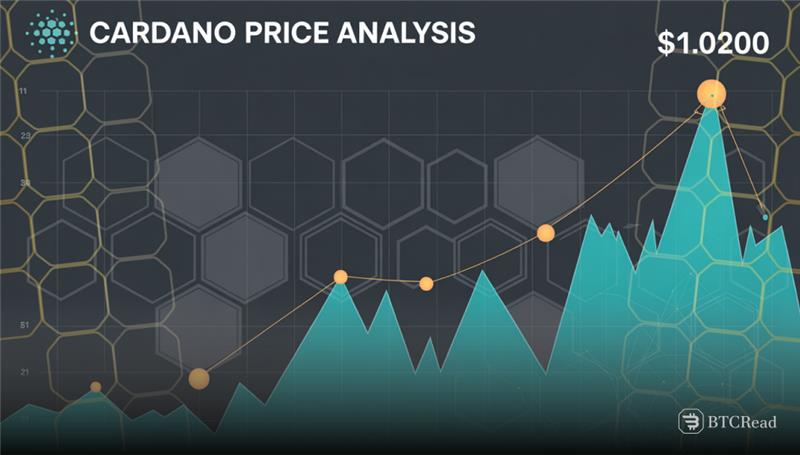
Additional resistance is ahead between $0.9450 and $0.9600, a supply area to monitor toward higher levels. Should momentum persist, $1.0200 still looms large as a target, a potential 24% move higher from current levels. A move below $0.8150 has a weaker outlook in mind and will draw ADA back toward $0.7850.
RSI and MACD indicate buyer control
Momentum indicators reinforce budding bull thesis. The Relative Strength Index (RSI) stands at 53.21, slightly above its moving average at 51.36. That level places ADA in a neutral-to-bullish zone and strength is turning in buyers’ direction. A breakout above 55–60 could further reinforce bullish momentum but a decline below 50 could signal new weakness.
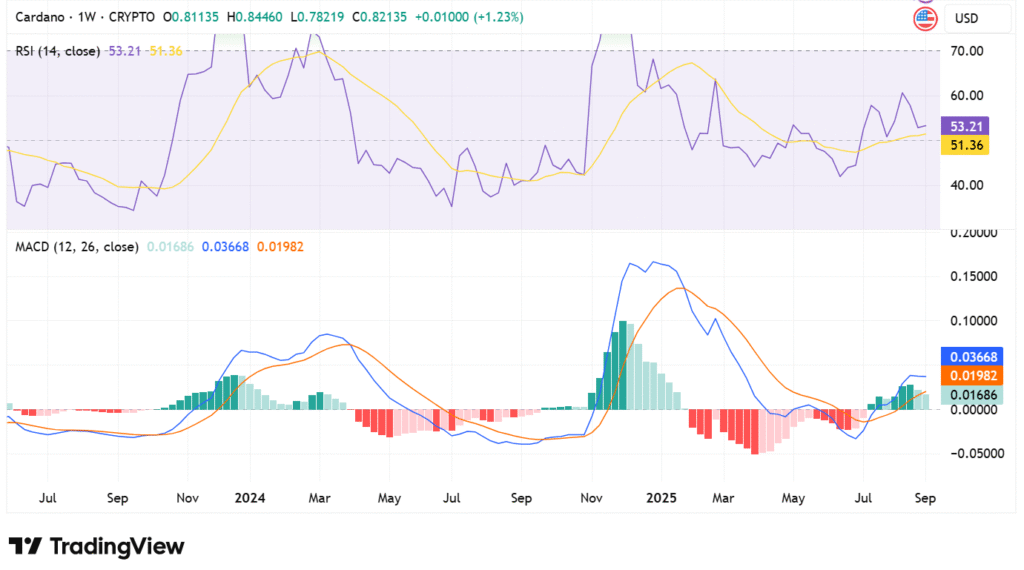
MACD adds to the bullishness too, with the main line standing at 0.03668 still higher than the signal line standing at 0.01982. A bullish crossover in recent weeks is verified by a positive histogram reading of 0.01686. More buyer supremacy is reflected by continued separation between MACD and signal line, calling forth continued upward continuation on ADA’s behalf if this is maintained.