
Cardano (ADA) has experienced a price journey over the last few years, marked by steep rallies and notable corrections. After a major 44% correction in early 2021, the token made a strong recovery. Now, with a 43% pullback occurring once again, questions are arising about whether ADA is poised for another leg up, this time potentially targeting $6.
Historical rally and correction cycles
Cardano price performance in 2020 and 2021 is noted for its explosive growth, particularly after the COVID-induced market crash. From its low during the market dip, ADA soared to an all-time high of $3.08 in February 2021, reflecting a staggering 4,095% increase.
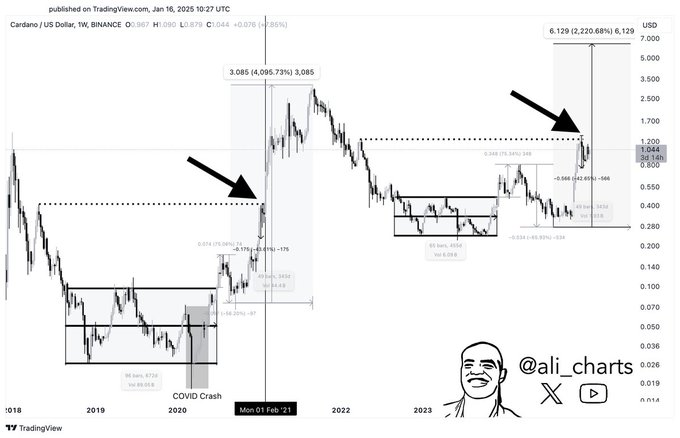
However, this rise was followed by consolidation, with ADA settling into a tight price range between $0.20 and $0.80. This long consolidation phase involved lower highs and higher lows, setting the stage for the next phase of price action.
Since then, Cardano has surpassed the $1.00 mark and is now testing critical Fibonacci levels. The 0.618 retracement at $1.20 is currently being eyed as a key resistance point. If ADA can break through this level, it could signal the potential for a sustained rally, with price targets shifting upward again, making $6 a conceivable long-term goal, provided the right conditions align.
Recent price decline and market sentiment
Over the last 24 hours, Cardano has experienced a 4.16% drop, moving from $1.04 to a low of $0.98 before recovering to $1.00. This decline is part of a broader trend of correction that has affected many cryptocurrencies in the market. ADA’s price action initially rose with some momentum but ultimately faced selling pressure, pulling the token back below $1.00.
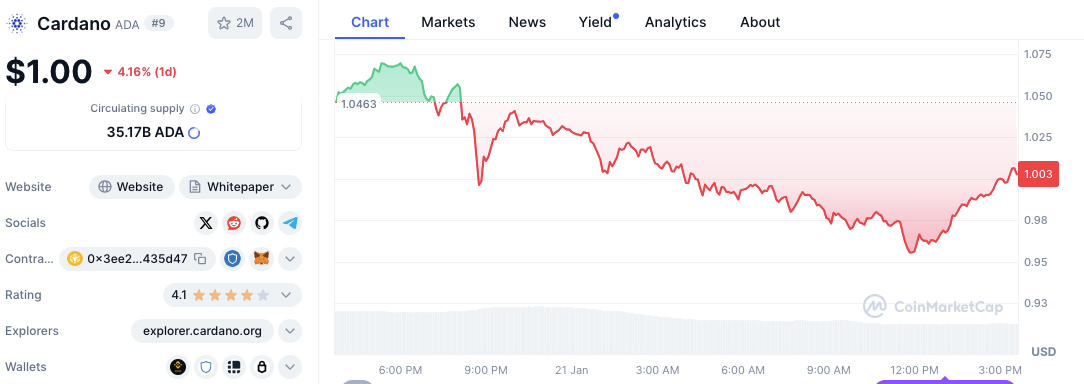
Despite this recent pullback, Cardano’s market position remains strong, supported by its large circulating supply of approximately 35.17 billion ADA tokens. However, the market sentiment, especially with prevailing bearish trends, has contributed to this dip.
Technical indicators suggest short-term potential for Cardano
According to technical indicators, ADA has tepid signs of recovery over the next few weeks. The current RSI reading of 48.83 points to moderate activity in the market but shows no clear bias.
ADA appears ready for an upward price surge based on recent RSI performance above 40.50. When the relative strength index surpasses 50 points, Ada shows increased buying power.
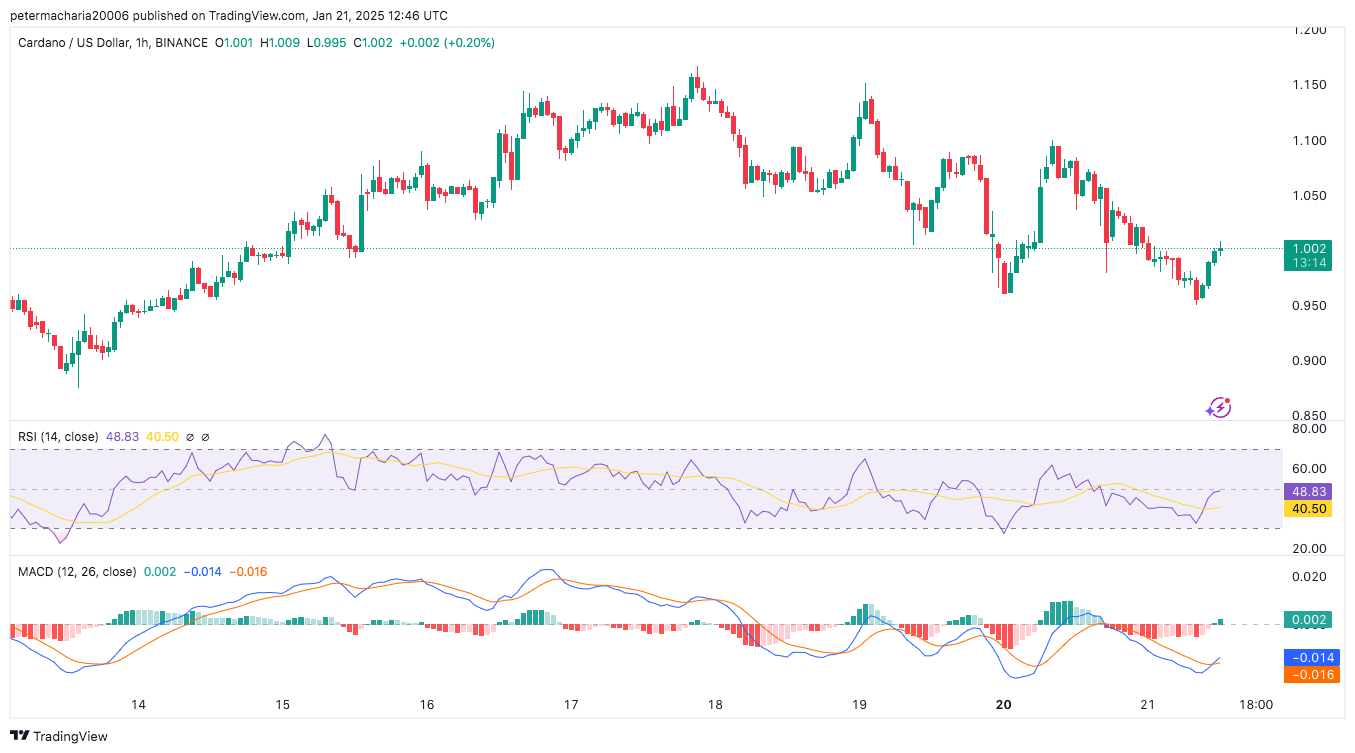
The MACD indicator predicts higher prices because its crossing signals demonstrate buying pressure. The indicator points to rising market strength as the MACD crosses and plots above its signal line. The MACD near-neutral levels signal that ADA could rebound in the market based on future conditions.


