Chainlink (LINK) is trading under the bearish pressure and is eyeing a decline in its value with the overall market due to market uncertainty after the recent surge. The LINK price over the last 24 hours is down by 2.27%, but over the last week it has been showing stability.
At the time of writing, LINK is trading at $24.91 with a 24-hour trading volume of $2.11 billion, up significantly by 80.16% over the last 24 hours. The coin has a market capitalization of $16.89 billion, which is slightly down by 2.26%.

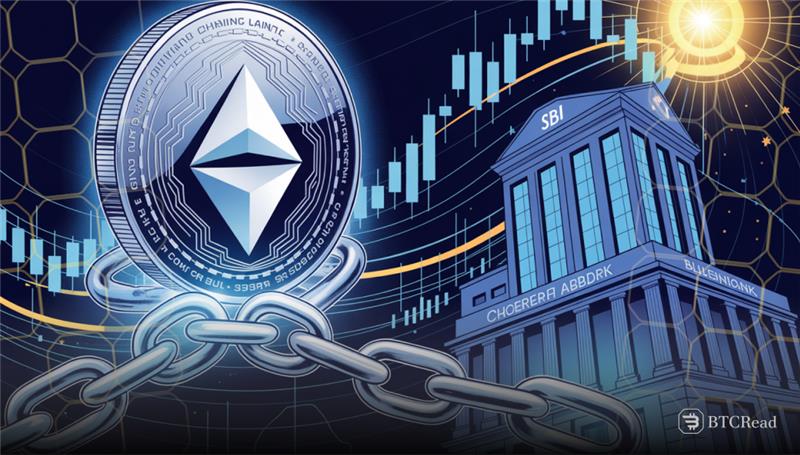
Chainlink-SBI partnership boosts institutional adoption.
SBI Holdings collaborates with Chainlink, the most widely used decentralized oracle network, to promote compliant digital asset infrastructure across Japan and Asia. Yoshitaka Kitao, SBI Holdings Chairman and CEO, described Chainlink as a natural partner due to its trustworthiness and interoperability. The collaboration will prioritize safe, compliance-ready solutions for cross-border stablecoin exchanges and will push the adoption of digital assets across institutional and retail sectors.
Meanwhile, the partnership arrives as Japan implements stablecoin rules, thereby cementing its position in blockchain development. SBI Group, a large financial giant with deep crypto connections, is employing Chainlink infrastructure to bridge conventional systems and blockchain technology. According to observers, the development is expected to allow tokenized securities, blockchain settlement levels, and better compliance solutions. SBI Group and Chainlink combine their forces to revolutionize payments and establish benchmarks in safe, regulated digital finance within the region.
LINK holds above EMA as bulls eye $30 breakout
Chainlink (LINK) is cooling off after the recent run-up, and the indicators are suggestive of consolidation. On the daily chart, the token gave back ground from the upper Bollinger Band at $28.62, finding resistance. The 20-day EMA at $23.39 is offering support, and the RSI at 58.36 shows the momentum easing back from the overbought region. The MACD shows ebbing upside strength.

The token has held above key moving averages, with the support levels ranging at $23.39, $20.32, and $18.20. On the higher side, resistance is at $28.62, with a psychological level at $30.00. A breach above that level may ignite fresh buying interest, while a failure to maintain support may pave the way towards $20.