Dogecoin ($DOGE) has recently made headlines with its impressive surge, breaking key resistance levels that had held steady since mid-2021. This move followed a bullish breakout from a classic cup and handle pattern, driving the price up by 300%.
However, despite this rally, there are growing concerns that Dogecoin could retest its breakout level at around $0.18 before any upward momentum. The price chart for Dogecoin reveals an exciting bullish trend. In mid-2024, the cryptocurrency broke through a critical resistance zone, setting the stage for a significant price increase that began in early 2025.
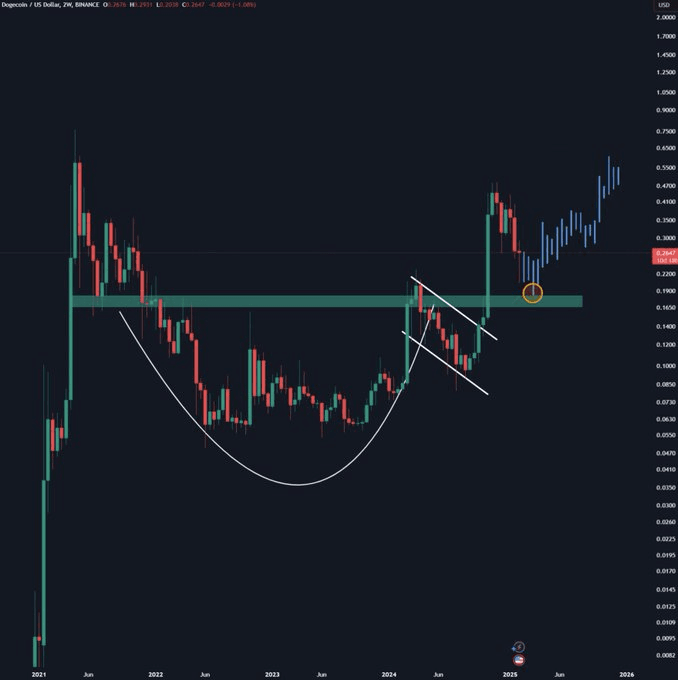
The formation of a cup and handle pattern was a crucial catalyst for this breakout, which saw $DOGE rise sharply after consolidating at lower levels. This technical structure has been regarded as a precursor to further upward movement in many assets.
However, despite the price surge, Dogecoin has yet to revisit its breakout level, between $0.17 and $0.18. The question is whether a retest of this support zone is likely before $DOGE continues its upward trajectory toward new all-time highs (ATH).
Volume and momentum: A mixed signal
The recent price action of Dogecoin indicates some weakening momentum. Currently trading at $0.2596, Dogecoin has seen a 2.99% drop in price over the past 24 hours and a decrease in trading volume, down by over 36%.
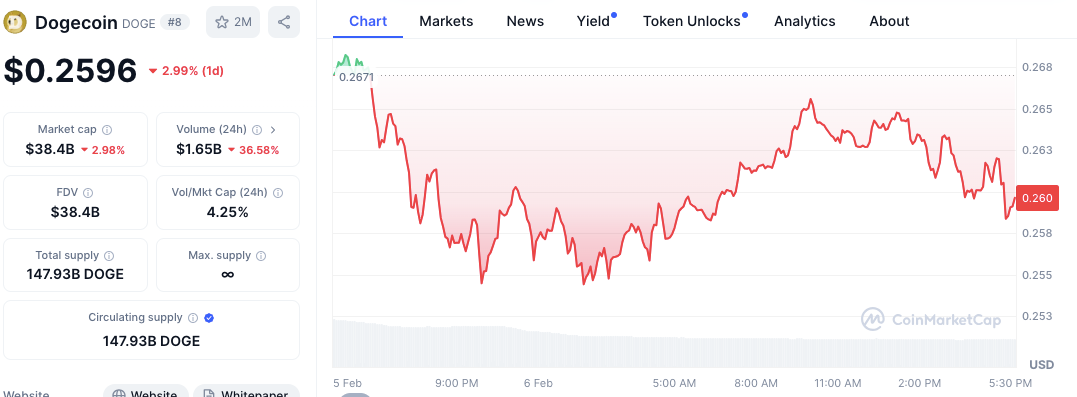
Despite the previous price rally, the current drop in volume suggests that market participants may be uncertain about the sustainability of the recent bullish move. This could lead to further price consolidation or a potential retest of lower support levels.
As Dogecoin has yet to test its breakout level, the $0.17-$0.18 range remains a key area of focus for many traders. A retest here would offer an opportunity to establish a stronger base before making another attempt at higher prices.
Technical indicators: MACD and RSI
The MACD indicator, which tracks the relationship between two moving averages, shows bearish momentum. The downward trend remains intact, with the MACD line at -0.0153 and the signal line at -0.0241. The histogram bars are also negative, signaling that selling pressure is still in play. Although the momentum is weakening, there is no definitive indication that the bearish phase has concluded.
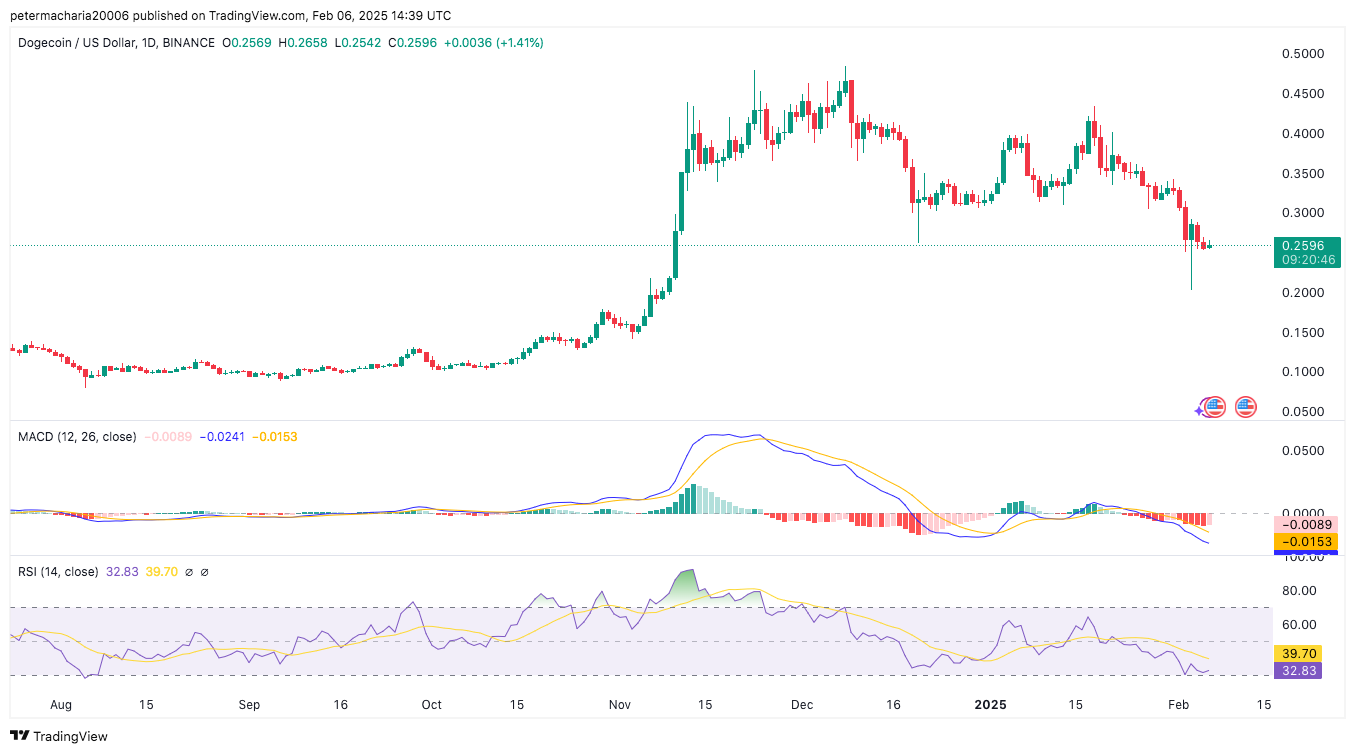
The Dogecoin RSI stands at 32.83. This means that Dogecoin is currently approaching oversold, which is a point for reversal. However, the RSI has not reached a critical level yet, which could indicate a strong rebound. Therefore, Dogecoin may be extremely oversold and ready to bounce from further downside.


