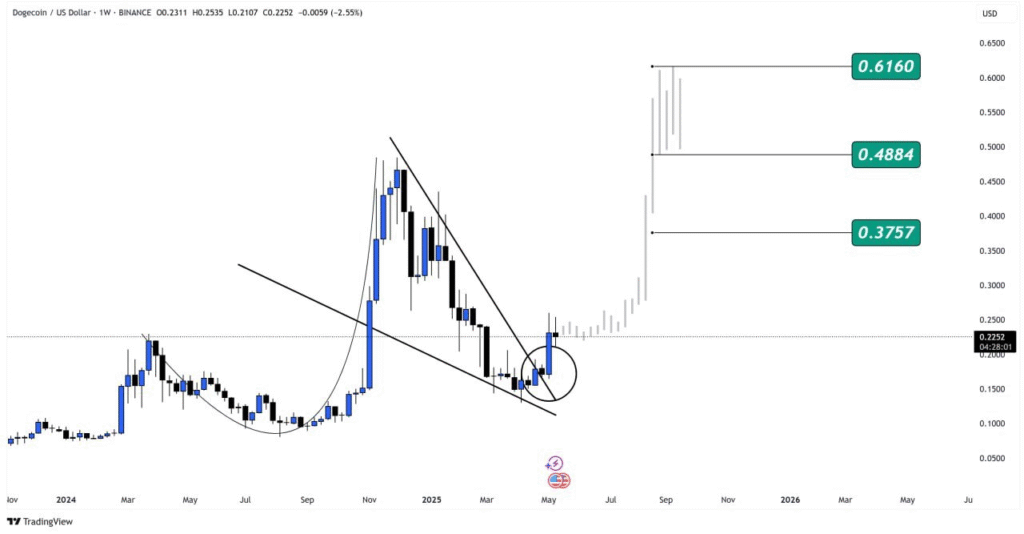
Dogecoin attracted investor interest as it picks up steam within an emerging structure developed over the last few months. Rose Premium Signals posted a technical chart on X that measured Dogecoin’s weekly price action from early 2024 through to May 2025.
The chart indicates a descending triangle structure, with lower highs converging into a strong base support at about the $0.10 level. The formation completed its construction by mid-2024 as Dogecoin rose above resistance and spiked strongly to almost $0.25.
Following that strong upsurge, its price came back to test the breakout zone at about $0.18 and remained firm at that level. This rounded bottom formation indicated accumulation in the markets, indicating traders and buyers were ready for the subsequent possible upsurge.
Dogecoin has held a support zone at $0.20–$0.22 that has served as a zone for long entries. These support areas with major buying points at $0.22 and $0.21 correlate with this zone and with earlier retests.
With Dogecoin holding above those zones, traders anticipate possible upsides towards $0.37, $0.48, and lastly towards $0.61. The above mentioned targets represent sequential targets based on breakout momentum and historical market action.
Dogecoin mirrors March 2025 breakout pattern
The chart also marks $0.14 as the stop-loss level, positioned below a recent swing low to reduce trading risk. Increased buying volume followed the breakout and added confirmation to the trend, despite brief consolidations.
Dogecoin’s current price structure mirrors historical patterns, especially the falling wedge breakout highlighted by CCN in March 2025. This technical chart shows increasing interest and optimism among crypto traders who watch $DOGE charts.
The existence of increasing volume with an organized support base shows optimism about additional price appreciation if support is maintained. So long as the bullish structure is intact, traders will keep focusing on $0.61 as the next level in their target.