
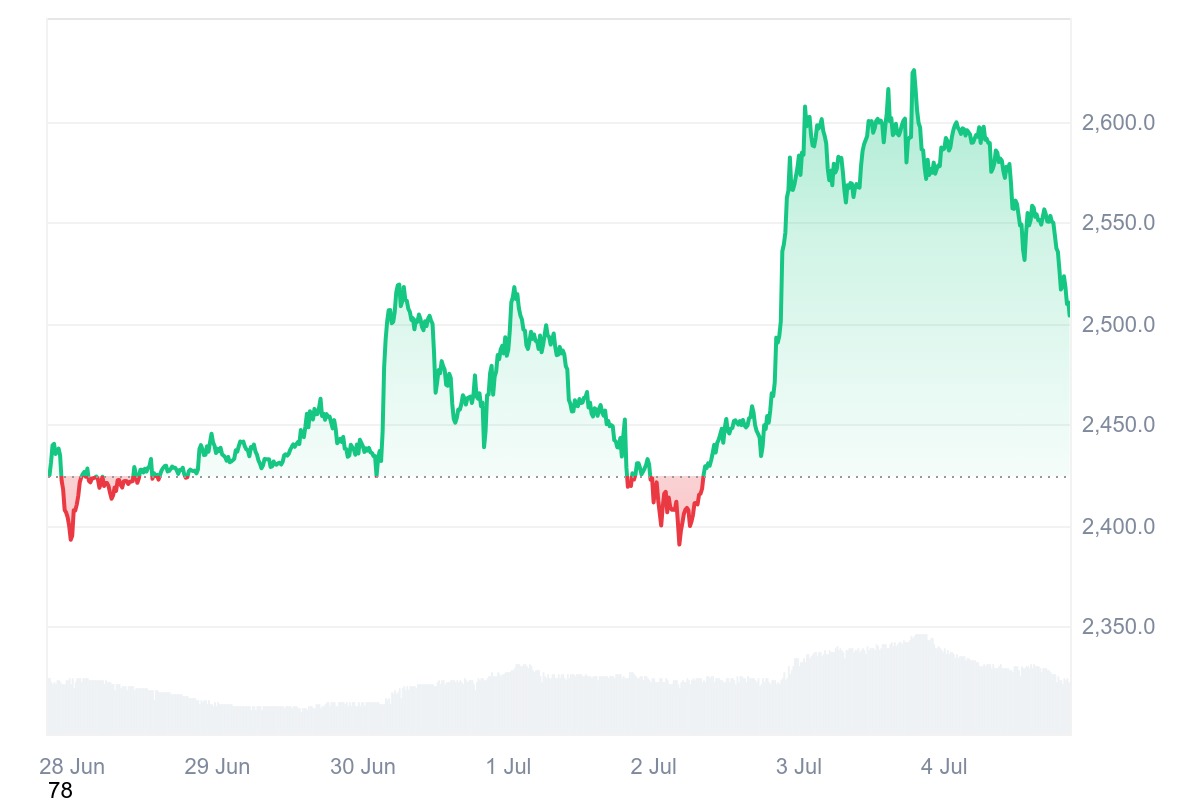
Ethereum is moving toward its positive track and is experiencing a rise in its price as the market as a whole recovers from several weeks of volatility in the market. The price of ETH in the last 24 hours decreased by 2.96%, whereas the price of the same in the last week has risen by 3.57%.
The current price of ETH is $2,505.58 with a 24-hour volume of $15.9 billion has gone down by 43.07% over the last 24 hours, and has a market cap of $302.28 billion. Moreover, the price of ETH is also placed in the middle of a symmetrical triangle. It also expects a bullish reversal in the time ahead.
Ethereum builds momentum toward $4,900 target
Ethereum is now consolidating in an obvious long-term symmetrical triangle pattern in its weekly chart indicating consolidation and likely accumulation before a significant price action. This chart pattern emerges as the price continuously oscillates between two parallel trendlines as the buying and selling pressures remain equally balanced in the long run.
Ethereum is now exploring around the 50-week moving average (MA 50). Traders typically encounter significant support or resistance at the most important technical area. Current price action indicates Ethereum building higher lows, suggesting rising buying demand and the potential for a shift in momentum.
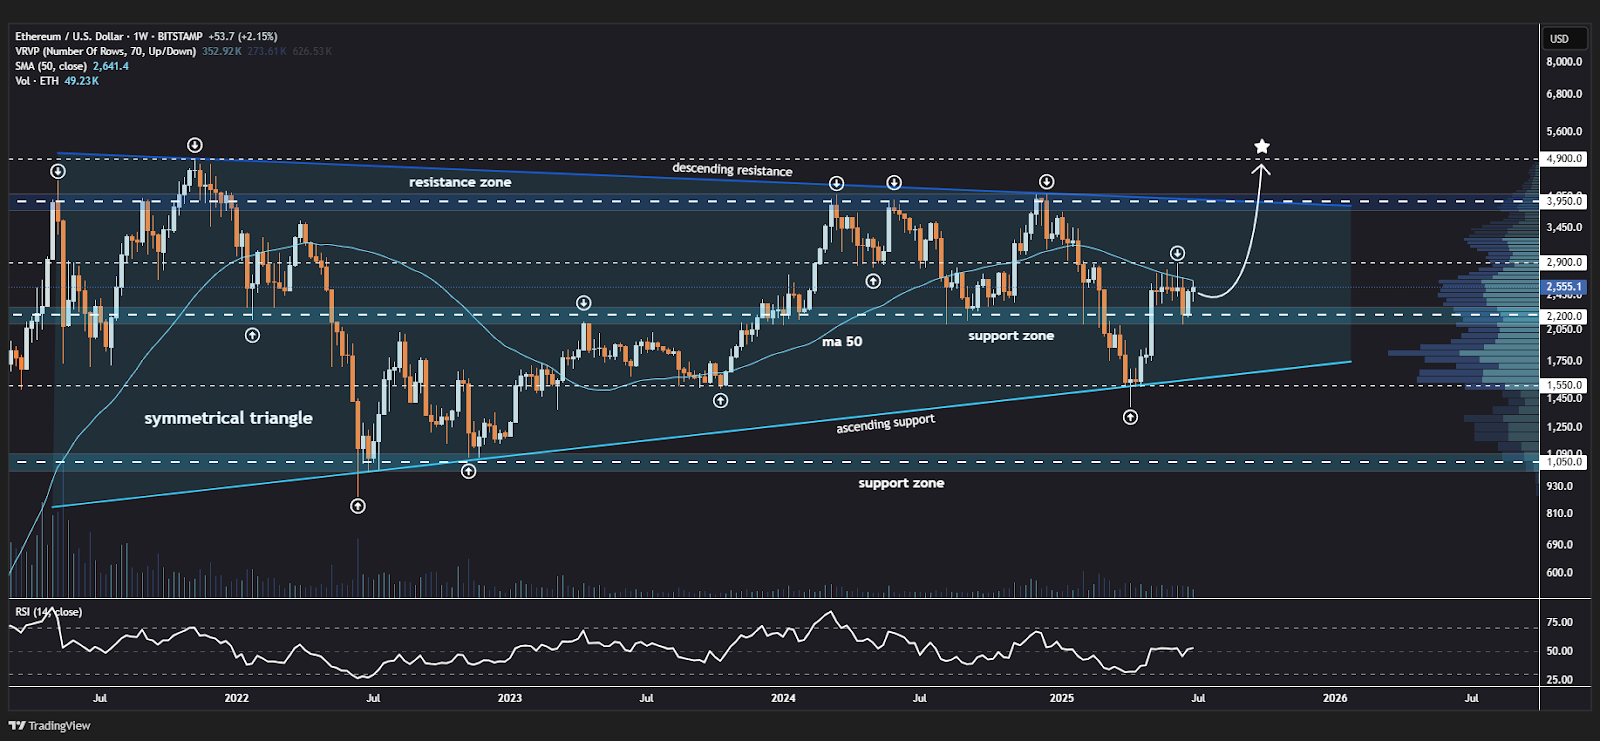
If Ethereum is able to break decisively above the 50-week moving average, it will initiate a bullish breakout. This break could push the price ahead towards key levels of resistance around about $2,900, $3,950, and finally around $4,900. These types of levels are significant turning points where traders will be looking for confirmation of further price movement and sustained bullish momentum.
Ethereum’s positioning in this symmetric triangle and investigating the MA 50 is a sign the asset is about to break out and could offer good prospects for investors and traders alike. Keeping up with these technical developments will be paramount as it will enable us to anticipate the next big price movement in Ethereum’s market.