
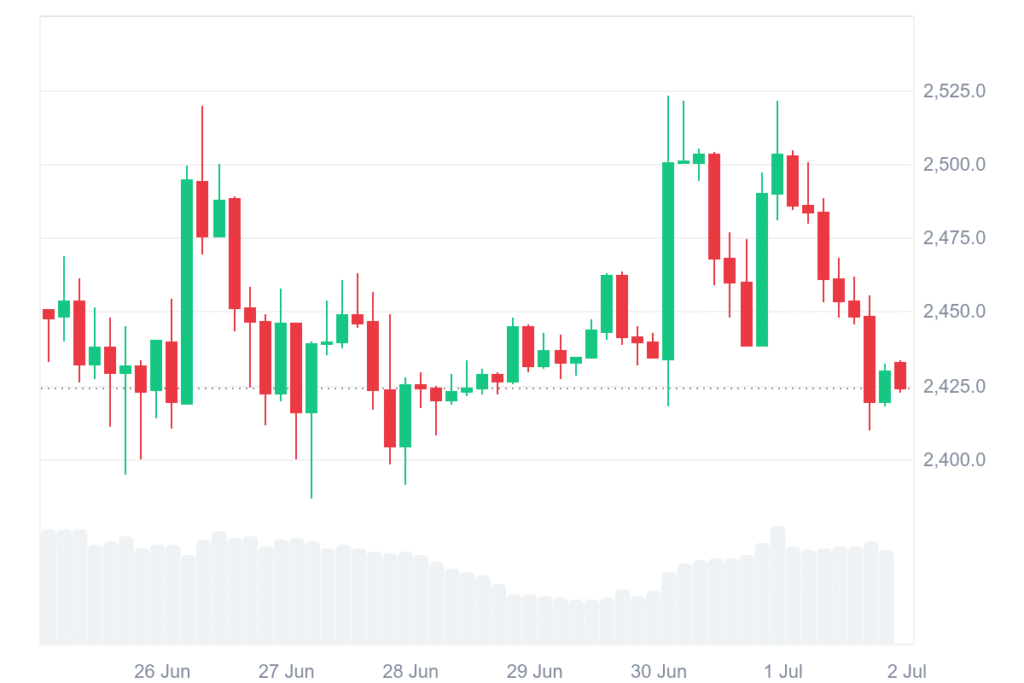
Today, Ethereum’s price stands at $2,426.58 with a transaction volume of $16.17 billion daily and growing interest. Cryptocurrency’s market capitalization now stands at $292.92 billion showing a stable position among major digital coins in circulation today.
Ethereum lost 2.67% in the past 24 hours but reflected strong stability and technical prowess in weekly charts. Considering short-term dips, analysts maintain their focus primarily on long-term movement of prices due to support triggered by recognition of patterns and previous behavior of prices.
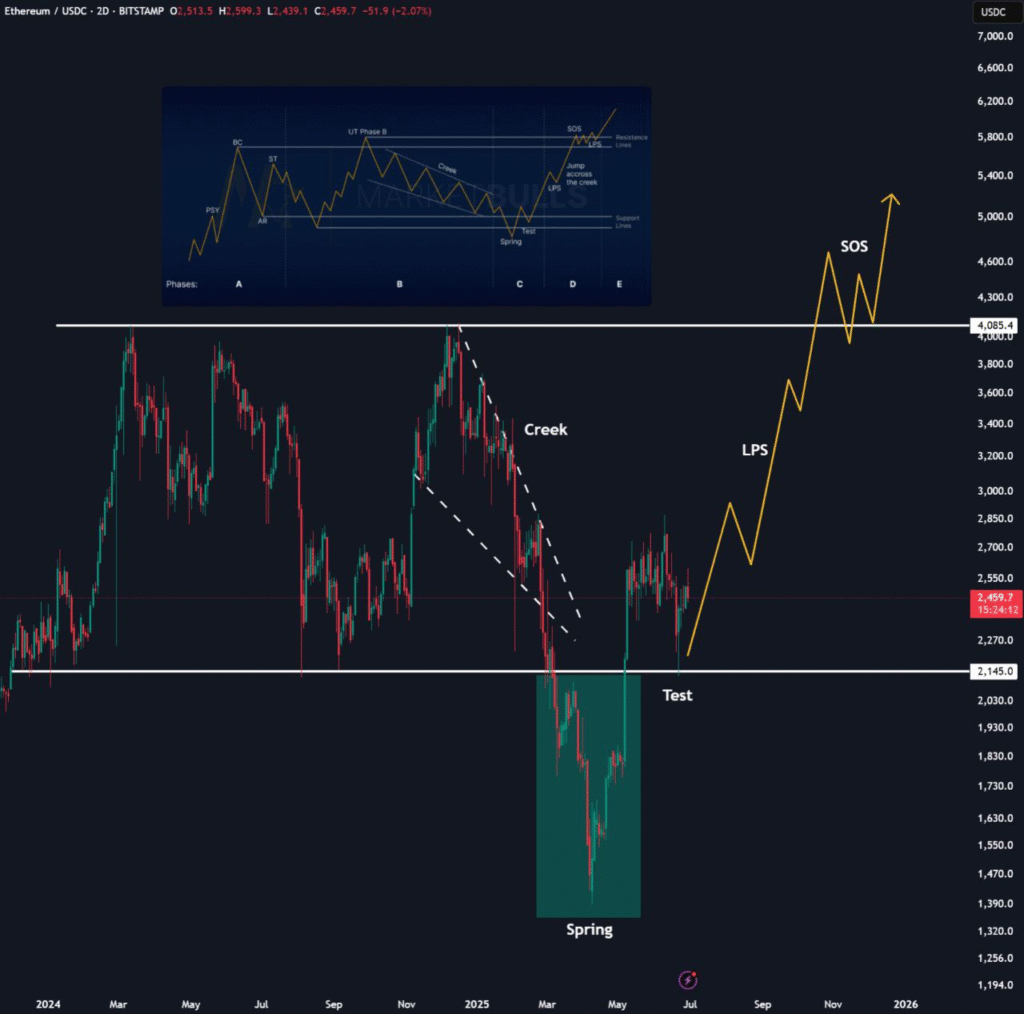
The latest technical chart published by analyst EtherWizz uses a Wyckoff accumulation model to forecast Ethereum’s prospective price action. The chart runs from mid-2014 to mid-2025 and uses a logarithmic scale from $100 to $5,000 per ETH.
This methodology, extremely popular in traditional trading environments, outlines five phases, Phase A through Phase E, of an asset’s cycle in terms of prices. Ethereum in Phase A took a steep down below $1,400, regarded as the selling climax that began the formation.
There was soon a rapid bounce back that represented the automatic rally that usually ensues with strong selling pressure. There was a confluence with a past 100% appreciation of Ethereum’s value in the wake of that fall.
In Phase B, Ethereum experienced a 25% correction and tested a key support area. It signifies this secondary test and spring point when the price briefly touches lows before building a solid base.
Ethereum breakout momentum builds with growing volume
The chart identifies this region as the “Test” and “Spring,” which are indicators of new investor interest that are both important.
Phase C begins upward traction with stable candlestick development and higher volume showing increasing accumulation activity. Ethereum has now reached Phase D, where the breakout occurs in a steeper fashion as demand overrules supply to push prices upward.
The predicted range in Phase E shows a direction that aims for $3,000 to $3,200 in July 2025. With this trend set to continue as predicted, Ethereum can exceed $4,000 in August or September owing to ongoing purchasing momentum backed by industry support.
Recent trade statistics also indicate a vigorous rebound around $1,900 that would sustain the bullish forecast if macroeconomic signs stand their ground. The Ethereum market also pays close attention to Bitcoin’s move because it tends to have an effect on how ETH performs in subsequent months.