
Ethereum’s price movements have followed a recurring trend linked to the Stochastic Relative Strength Index (Stochastic RSI). Historical data indicates that past crossovers at oversold levels have preceded price increases. Current market conditions suggest Ethereum could be nearing a similar setup, raising questions about whether this trend will hold.
Ethereum’s stochastic RSI indicates potential price shift
The Stochastic RSI measures momentum by analyzing price movements relative to recent highs and lows. When the indicator crosses upward from oversold levels, Ethereum has historically experienced price increases. Analysts tracking past market cycles observe that similar crossovers have preceded strong rallies.
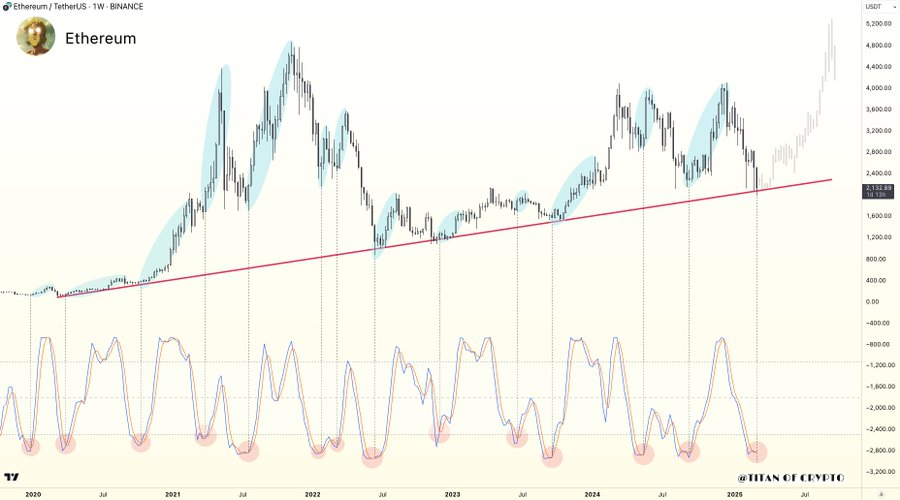
Several instances support this pattern. In other bullish sentiments before, the price of Ethereum rose after the weekly Stochastic RSI crossover at the oversold range. Taking the movements of such a market as the one from the year 2020 to 2025, it is possible to identify severalvirtual rebounds from long-term support lines.
The volatility in the Ethereum market remains relatively stable in the bullish trend, hence support levels. The latest movements depicted here are an upward movement that crosses the previous resistance levels and levels up as indicated below.
Ethereum’s market performance reflects upward momentum
According to CoinMarketCap data, Ethereum is priced at $2,187.17, reflecting a 2.29% increase within 24 hours. The market capitalization stands at $263.77 billion, marking a 2.30% rise. The fully diluted valuation remains equal to the market cap, indicating that the total supply affects valuation. Ethereum’s 24-hour trading volume is $9.71 billion, experiencing a 45.40% decline. The volume-to-market cap ratio stands at 3.67%, providing insight into liquidity.

The circulating supply of Ethereum is 120.6 million ETH, matching the displayed total supply. The price chart illustrates fluctuations over the past day, showing a low of $2,137.4 before rebounding above $2,200. At the time of press, the recorded price remains $2,187.17, with a 24-hour volume of approximately $9.69 billion.
Ethereum shows some backbone of a bull run as there seems to be significant buying pressure at specific time frames. The chart shows daily fluctuations, after which there is a rise and slight retracement. Ethereum shows a 4.6-star rating; basic contract information is available for viewing on its blockchain explorer and more in the resources section.


