
Hedera (HBAR) has shown signs of potential growth in its recent market performance, with traders and investors closely watching the asset’s movements. The price is hovering around $0.31, reflecting a minor dip of 1.13% in the past 24 hours.
Despite this, the token’s market structure suggests an ongoing consolidation phase, which may set the stage for a breakout that could propel HBAR towards the $1 mark.
The $0.33 mark has been identified as a key resistance level for Hedera. According to Wyckoff’s theory, the chart indicates that the price has been consolidating below this level, forming a “Spring” structure.
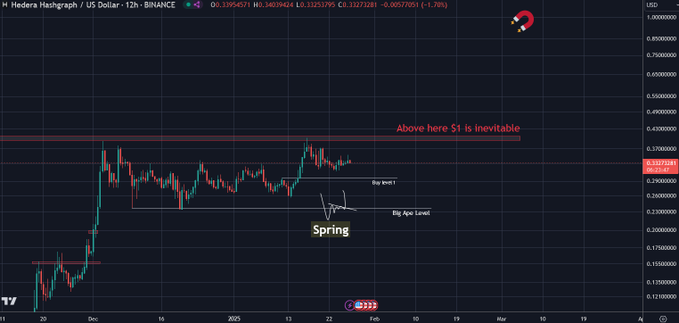
This suggests that HBAR may be in an accumulation phase. A possible reversal could occur if it successfully breaks above this resistance level. If HBAR surpasses $0.33, the price could move toward $1, as the chart’s analysis indicates a strong bullish potential.
The asset’s consolidation occurs near a critical support zone known as the “Big Area Level.” This zone has acted as both a resistance and support point in recent price action. A breakout above this resistance level could trigger further price action, leading to a more significant upward movement.
Market data and momentum
HBAR’s current trading value is $0.3148, and its market capitalization is $12.04 billion. The daily trading volume has increased by 24.69%, reaching $675.3 million, indicating healthy market activity. This increase in volume suggests growing investor interest and a possible buildup for a breakout.

The circulating supply of HBAR is 38.26 billion, with a maximum supply of 50 billion, indicating significant room for price fluctuations. The fully diluted valuation (FDV) stands at $15.73 billion, which indicates a higher market potential should the full supply come into circulation.
Technical indicators: RSI and MACD
Looking at technical indicators, the Relative Strength Index (RSI) is currently at 50.58, signaling a neutral market with no immediate signs of overbought or oversold conditions. This neutral reading suggests a balanced market, but the RSI is trending upward, potentially signaling the start of a bullish phase if it continues rising. A move above the 57.43 mark could signal that HBAR enters the bullish zone.
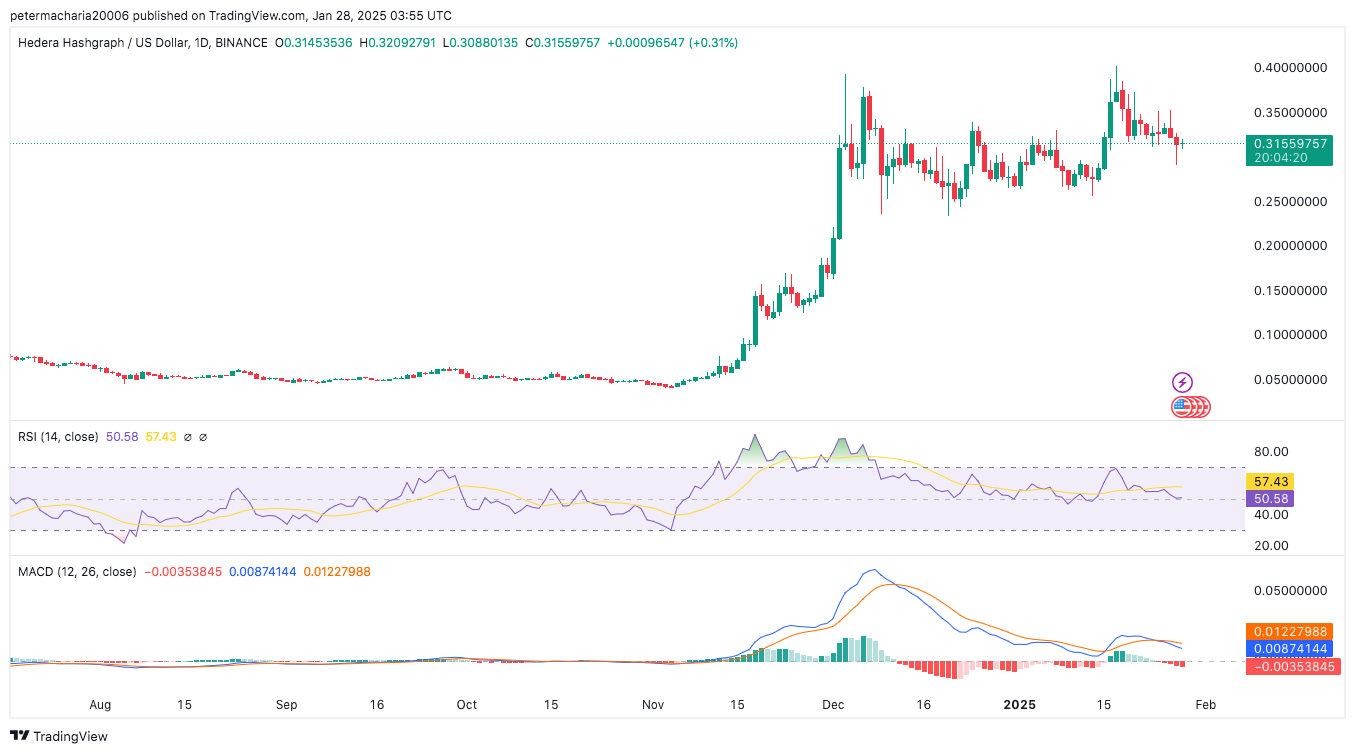
The Moving Average Convergence Divergence indicator shows bullish signals due to its current market position. Bullish momentum grows because the MACD line sits above the Signal line at values of 0.0123 and 0.0087.