Cardano (ADA) has shown impressive growth recently, rising 5.98% to $0.9857. ADA continues to attract attention in the crypto market, with a market capitalization of $34.65 billion and a trading volume of $1.15 billion in the past 24 hours.
Although the trading volume has slightly declined by 14.57%, the ongoing price surge signals that ADA might be gearing up for further growth.
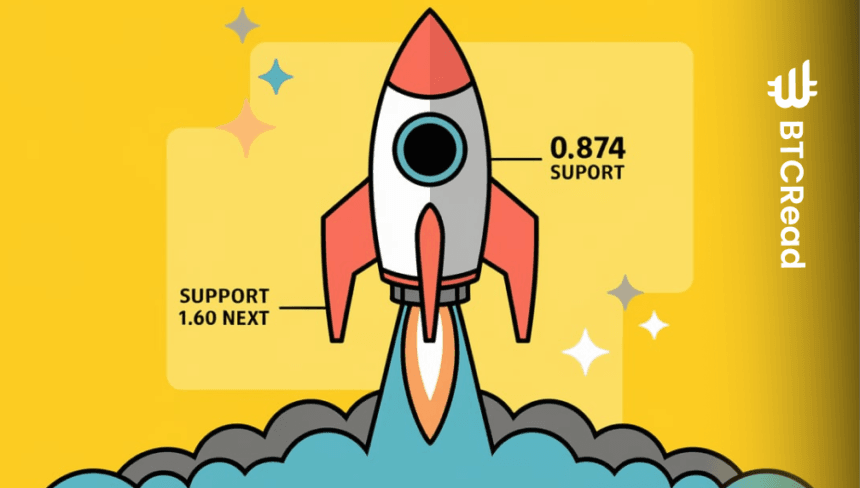
Cardano’s price has remained between $0.874 and $1.327, with strong support forming around the $0.874 level. The consistent formation of higher lows since the swing low on December 19 indicates that Cardano could be in the early stages of an uptrend.
A pullback into the $0.829 to $0.879 demand zone could present a good opportunity for buyers, as this area has historically acted as strong support. Should ADA maintain this structure, the likelihood of upward momentum increases.
Cardano price targets: Key resistance levels
Looking ahead, ADA has several price targets to aim for. The next immediate resistance levels are $1.10 and $1.32, which could act as hurdles for the token in the short term.
If ADA breaches these levels, the next potential resistance could be $1.60, offering an upside potential. Breaking through this level would confirm the strength of the bullish trend, paving the way for further price increases.
Market structure and long-term growth potential
Cardano’s market structure continues to indicate a healthy and growing asset. The circulating supply stands at 35.15 billion ADA, with a total supply of 44.99 billion and a maximum supply of 45 billion ADA tokens.
The fully diluted valuation (FDV) of $44.35 billion highlights the potential for long-term growth, assuming the market continues to support the asset. Additionally, the volume-to-market cap ratio stands at 3.32%, reflecting a relatively healthy market liquidity environment.
MACD and RSI: Short-term indicators point to bullish momentum
In addition to price action, technical indicators such as the Relative Strength Index (RSI) and Moving Average Convergence Divergence (MACD) provide insight into ADA’s short-term outlook.
The RSI currently stands at 55.60, suggesting that Cardano is neither overbought nor oversold, with room for further price movement. A value above 50 indicates bullish momentum, and if the RSI rises toward 60, it would further support the potential for continued upward movement. However, should the RSI dip below 50, it could signal a weakening momentum, which may result in a price correction.
MACD also indicates the bullish setup. As for the MACD line, it is positioned at 0.004, and the signal line is at -0.003 which shows positive divergence, albeit very small. The position of the small green MACD histogram indicates that buying pressure is gradually rising. However, if the MACD line continues to cross the signal line above the midline with a rising slope, we can have a bullish crossover that reasserts the theory of a rising price in the market.


