
Litecoin (LTC) is showing signs of a potential price surge, with a key technical setup suggesting that the $145 target could be just the beginning.
Currently trading at $121.42, Litecoin has displayed bullish indicators across multiple timeframes, allowing traders to anticipate further upward momentum. As market activity intensifies, short-term and long-term trends point toward a possible rally. Several crucial price levels mark the path forward.
Technical indicators point to bullish sentiment
Analyzing Litecoin’s price action on the 1-hour chart reveals the formation of a bullish reversal pattern. This pattern is potentially a double bottom near key support levels. These patterns often signal a shift from downward to upward momentum, suggesting that LTC may be poised for an extended rally. Analysts identified a support level near $114.50, and the price recently bounced off this zone before continuing to rise.
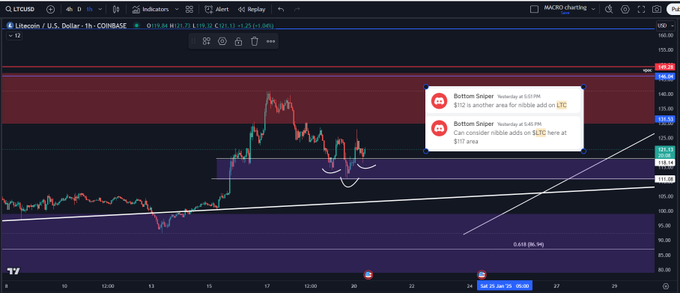
A rising trendline further reinforces the positive outlook, illustrating that Litecoin has maintained an overall uptrend. However, the price has encountered resistance near the $140 mark, preventing a breakout beyond this level. Despite this, market observers remain optimistic about LTC’s prospects, especially if it surpasses this critical resistance.
Entry points and potential for gains
For traders, several entry points present themselves within the current market structure. Notably, there is a potential opportunity to add to positions near the $117 support zone.
These strategic entry points allow investors to capitalize on price dips before a potential breakout. The $145 target is achievable in the near term, though experts caution that this is likely the first of many milestones on the way to higher targets.
RSI and MACD suggest positive momentum for Litecoin
Supporting the bullish outlook, Litecoin’s Relative Strength Index (RSI) sits at 57.38, indicating that the asset is neither overbought nor oversold. A value above 50 suggests that buying pressure is present, with room for further gains without reaching overbought territory. Traders should monitor the RSI’s movement to determine if the bullish trend continues, as it has shown consistent upward movement recently.
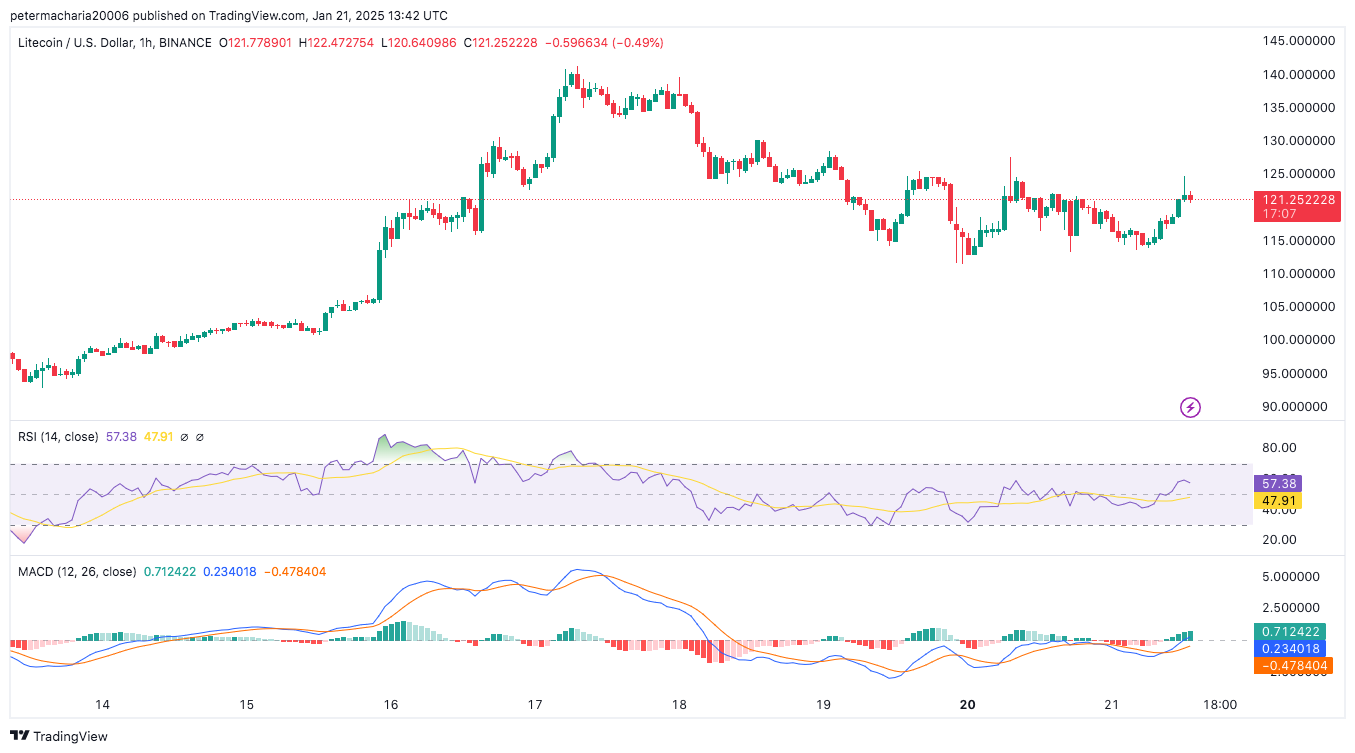
MACD gives a signal that confirms the market trend is growing stronger. By showing the MACD line above the signal line, the indicator tells us that purchases today will surpass sales tomorrow.