
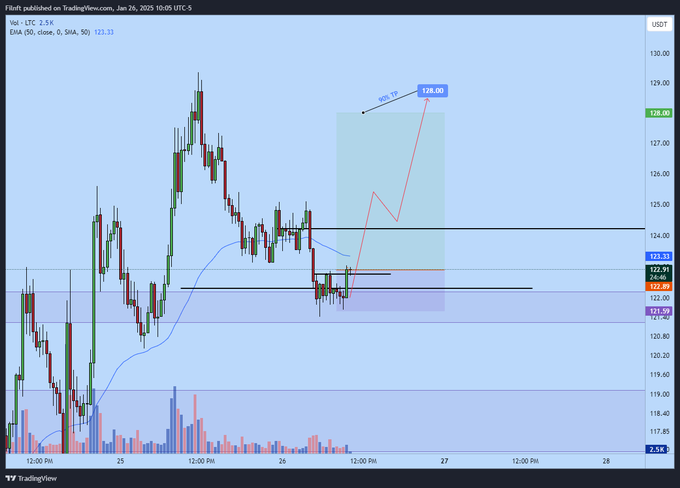
Litecoin’s recent performance has attracted attention due to indications of a potential upswing toward $128, which represents roughly a 5% increase from levels near $122.50.
Data shows that price action consolidated around the $122.50-$123.00 area, aligning with the 50-period Exponential Moving Average (EMA). During this phase, trading volume remained modest, and analysts reported that any breakout above nearby resistance might trigger a substantial price rally.
Despite the bullish scenario, Litecoin encountered a sharp decline of 9.53% in one session, falling to $110.37 from a high of $121.76. The market capitalization now stands at $8.32 billion, while 24-hour trading volume surged 61.91% to $1.04 billion.
Regarding supply, 75.46 million LTC are already circulating out of a total cap of 84 million. The steep drop suggests that sellers exerted considerable pressure, prompting short-term volatility.
Support and resistance levels
Recent charts identify a demand zone between $121.99 and $122.50, an important support region. A breakdown beneath this band could invalidate the bullish outlook. On the other hand, resistance near $124.00 remains pivotal.
Observers note that a sustained move above this threshold may open the path to the \$128.00 mark, previously highlighted as a 90% take-profit zone. Volume spikes during any breakout could reinforce upward momentum.
The volume-to-market-cap ratio, currently at 12.48%, indicates active trading, yet further confirmation may be required to verify direction. If Litecoin holds above $121.99 and crosses $124.00 decisively, a bullish push toward $128 remains a possibility based on the recent technical framework.
Price movement around the $110 level is also under close watch. According to available data, any failure to reclaim higher ground could prolong bearish momentum, while a firm break above $124.00 may set the stage for the anticipated 5% surge to $128.
Litecoin technical indicators
The Moving Average Convergence Divergence (MACD) and Relative Strength Index (RSI) provide insights into Litecoin’s momentum. Current data shows the MACD line at 2.89, slipping below the signal line at 2.42.
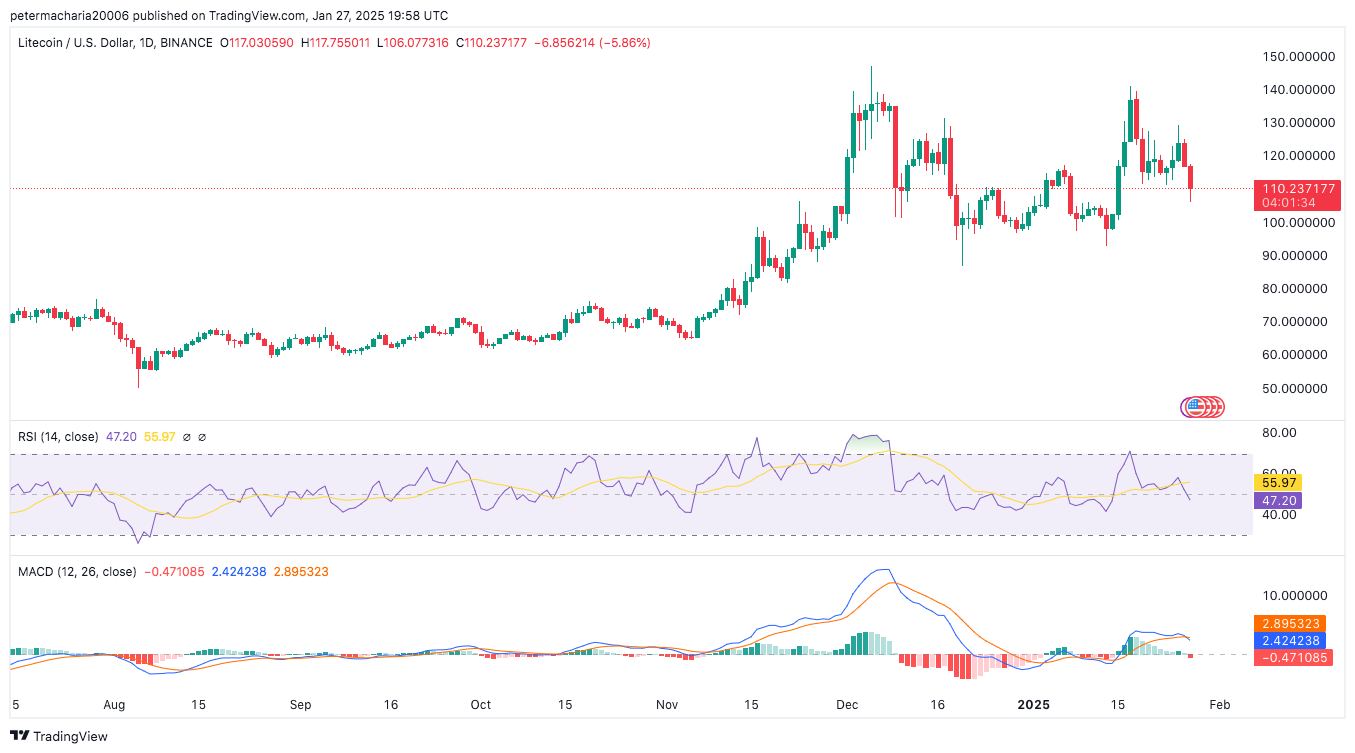
The negative indicator position reveals the market experiences diminishing upward market strength. The RSI indicator registered a decline from 55.97 to 47.20 during this period while indicating rising supply activities. A continued descent underneath 30 in this area may signal that market conditions are becoming oversold.