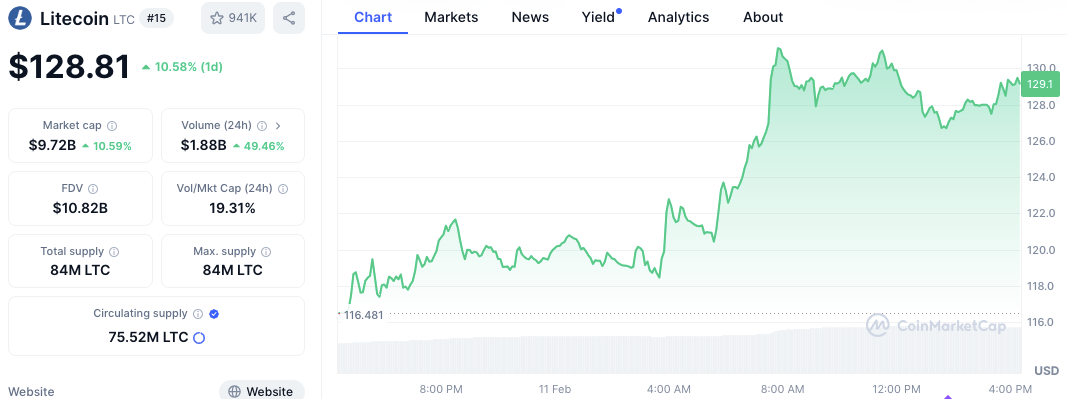
Litecoin (LTC) has recently broken above key resistance levels, showing a bullish momentum. The token surged above $120 and reached as high as $129, marking a substantial 10.58% increase in 24 hours.
This surge comes with a 49.46% rise in trading volume, indicating strong buyer interest and market participation. Litecoin’s market cap now stands at $9.72 billion, reflecting an increase of 10.59% during this period. Key technical indicators support the upward trend, making LTC a focal point for market watchers.
Ichimoku Cloud: A clear bullish signal
The Litecoin price chart, which tracks LTC/USDT on Binance, reveals that the price has risen above the Ichimoku Cloud, signaling a bullish trend. The green line (Tenkan-sen) is above the red line (Kijun-sen), further confirming upward momentum.
Additionally, the cloud itself is bullish, suggesting that LTC is in a strong uptrend. With the price well above the cloud, this technical setup supports the potential for continued upward movement in the near term.

With the current bullish indicators, Litecoin can test higher resistance levels. Key price targets in the near term include the $132-$135 range, with a possible breakout towards $145 if the momentum holds. However, if momentum begins to cool, traders should watch for support around $120, with a deeper pullback possible to the $108-$112 range.
Litecoin technical indicators: RSI and MACD
The Relative Strength Index (RSI) currently stands at 61.47, indicating that Litecoin is in positive momentum but not yet in overbought territory. While this suggests there is still room for further price movement, traders should be cautious as the RSI approaches the 70 level, which could indicate an overbought condition.
Meanwhile, the volume spikes on the chart reinforce the bullish sentiment, with volume rising alongside price increases, a typical sign of strong market participation and ongoing buyer interest.
Positive MACD indicator results from a divergence where the MACD line reaches 0.950624 and the Signal line stands at 0.202686. The positive crossover between lines indicates Litecoin’s potential continuation of price growth.
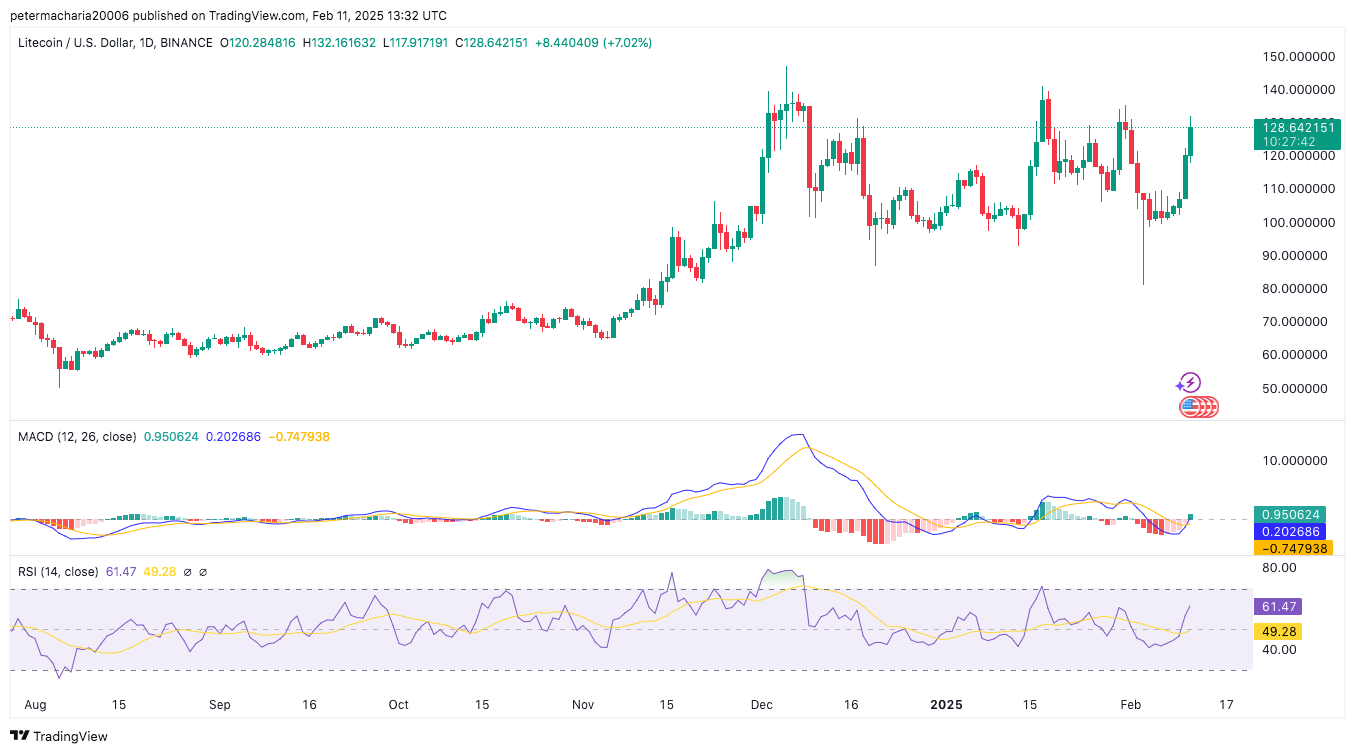
The MACD histogram also displays green bars, which indicate a rising positive market sentiment. The HA-CAD momentum indicator indicates a potential momentary slowdown before the potential continuation of prices.


