Litecoin is changing hands at $85.79 with a market cap of $6.51 billion and a daily volume of $334.77 million. The LTC price has advanced by 2.29% over the last 24 hours as a sign of higher buying interest from speculators.
However, the coin has recorded a 3.54% decline over the past week, indicating ongoing uncertainty in market sentiment. Since the last seven days, Litecoin has been extremely volatile and traded within a very confined range of $82 to $90.
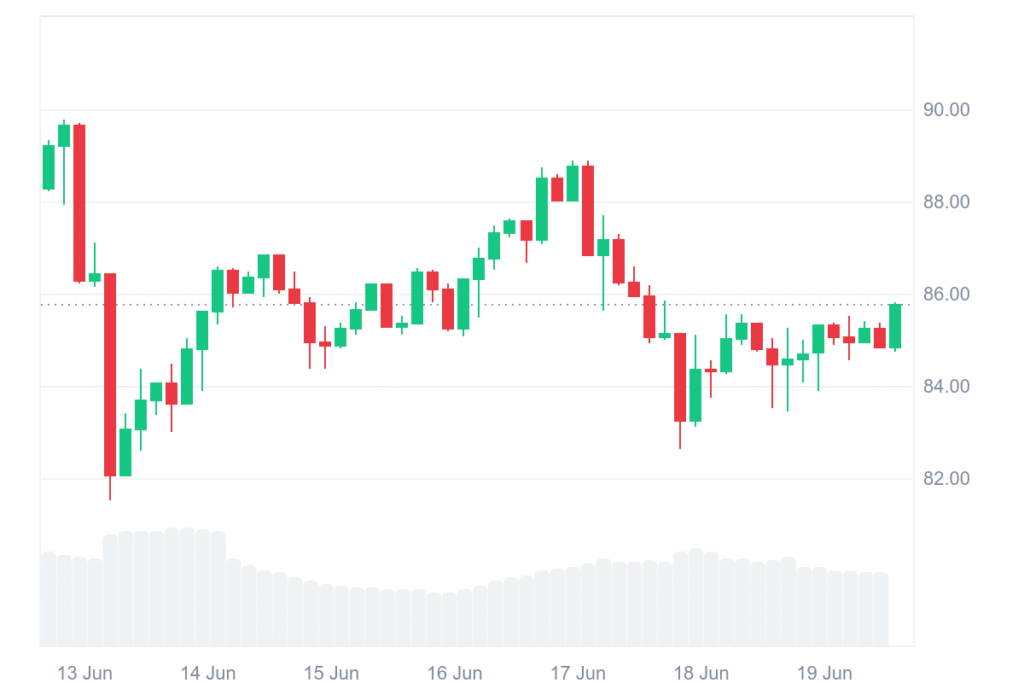
The week started with a quick price decline which pulled LTC to the lower support level of $82. The drop was during a higher volume when the increased selling pressure on the large exchanges was prominent. The bulls later sought to reverse the direction of the market and regained the price above $85.
The rebound veered into a sideways direction as LTC found it hard to sustain onward movement versus persistent resistance and conflicting market indications. The candlestick formations presented alternating red and green days, noting the buyer-seller tug-of-war about key levels.
Technical indicators suggest imminent breakout for Litecoin
Litecoin made another breakout attempt in the middle of the week, reaching as high as nearly $88 but selling pressure resumed and ended the rally.
After a small drop back to support areas, the coin resumed its rally and is now range-bound around $85.81. Bollinger Bands indicate price compression and the upper and lower bands stand at $88.43 and $83.10, respectively, and hint at a possible breakout.
The 9-period exponential moving average is at $85.19, marginally below the current market price, a sign of short-term bullish support. RSI is at 50.74, in a neutral range for LTC, while MACD shows early clues of bullish crossovers.
If the current buying interest persists, Litecoin can touch $88.50 in the immediate term, with an extended target of $91.00. However, a price fall below $85 would trigger a new test of the support range at $82.50.