
Litecoin ($LTC) is showing strong signs of a breakout, with a surge in both price and trading volume that has captured the attention of the crypto market. As of Jan. 16, 2025, Litecoin’s price surged by 15.43%, reaching $118.42, sparking speculation about its next move.
With key technical indicators pointing to bullish momentum, Litecoin could be on the verge of a price rally. The target zone is now identified between $233 and $280.
A deeper look at Litecoin’s long-term price chart reveals a pattern that could signal a major rally. The asset forms a “double bottom” or “W” pattern, often seen as a bullish reversal signal. This formation suggests that after two price troughs, Litecoin is positioned to break above its resistance line and move higher.
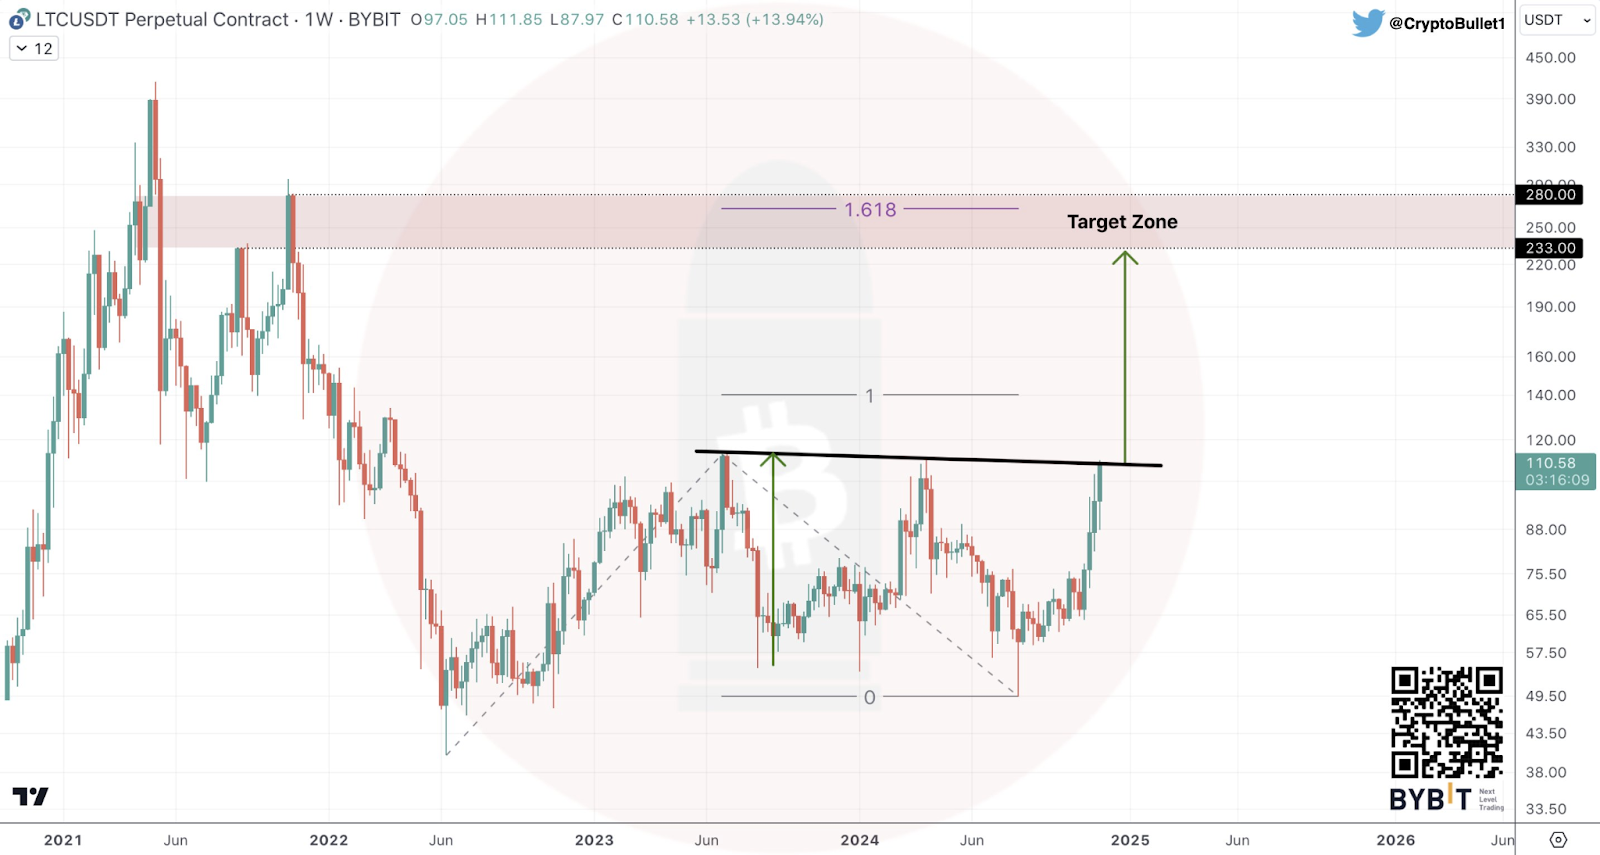
Currently hovering around the $97 mark, a breakout above this level could lead to price gains. Based on the 1.618 Fibonacci extension level, analysts eye a target range of $253 to $260. If Litecoin manages to push through this key resistance zone, the price could continue to climb toward the $233-$280 range.
Litecoin impressive surge and volume increase
During the time of writing, Litecoin saw a significant price increase and experienced an extraordinary rise in trading volume. The cryptocurrency’s trading volume spiked by 319.42%, reaching a remarkable $1.75 billion in the past 24 hours.
This surge in trading activity is a strong indicator of heightened investor interest, which typically precedes further price movement. The market cap of Litecoin has now reached $8.93 billion, with a circulating supply of 75.42 million LTC, adding to its appeal as a relatively scarce asset with rising demand.
Short-term momentum: RSI and MACD signals
On the one-hour chart, technical indicators provide valuable insight into Litecoin’s short-term price action. The Relative Strength Index (RSI) stands at 79.71, signaling that Litecoin may enter the overbought territory. An RSI above 70 often suggests a potential pullback or consolidation, as buying pressure could ease.
Nevertheless, MACD continues to be all green, with the MACD line now above the signal line. The histogram is also green, which supports the strong positions of the current bullish trend.
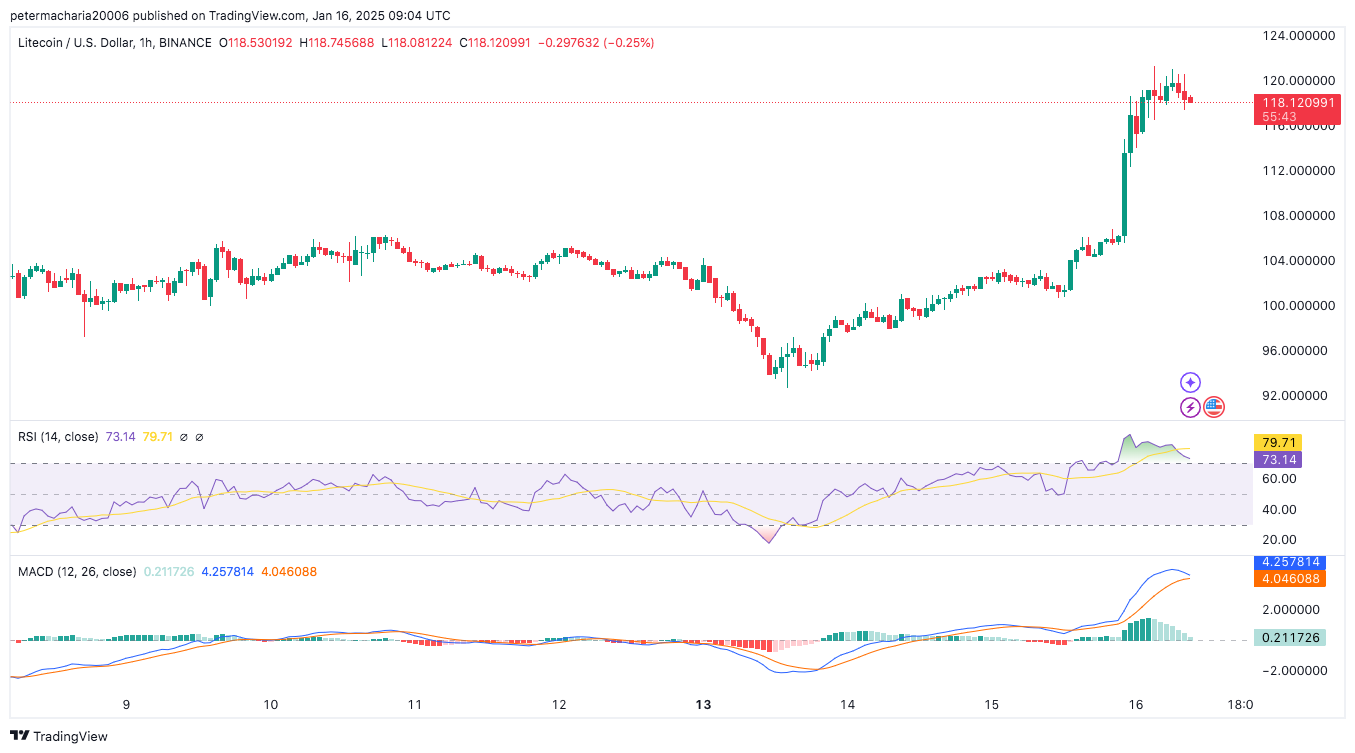
Even though the RSI is overbought the MACD crossover signaling a right side crossover means that the bulls could still see some short term gains. Litecoin has been trending to set the $120 mark as a major resistance level, while a brief period of consolidation or correction may be seen, the currency is likely to head up provided the momentum persists.


