
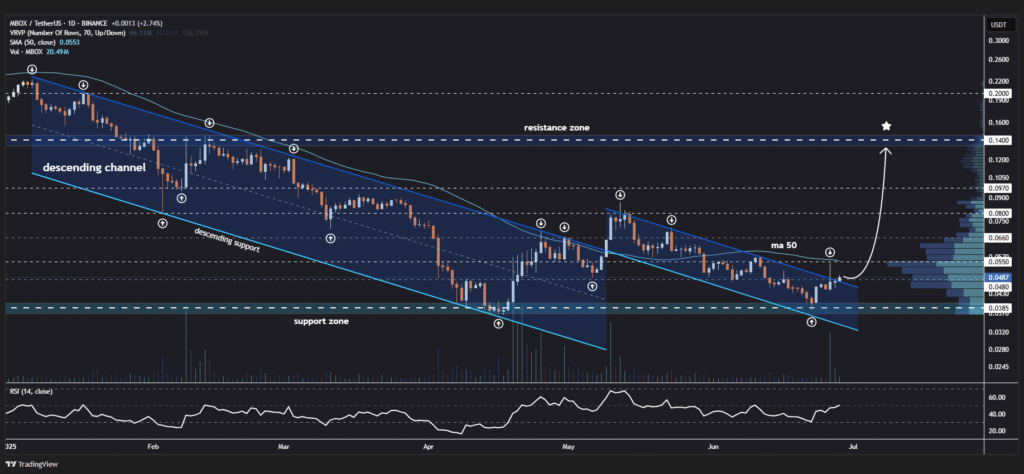
Crypto token MOBOX (MBOX) just broke out from long-established descending channel pattern plotted from its daily chart. This descending channel emerged when the price has formed two downward-sloping trendlines, thus creating frequent lower highs and lower lows in the long term.
The rise through the upper resistance trendline signals the potential shift of sentiment from bearish back towards bullish. For those traders following such a chart setup, the breakthrough would be considered by them a good reversal signal, especially if confirmed by additional indicators. MOBOX is currently trading at the level of $0.0447, an indication that the asset is testing an important technical level for confirmation.
Focus next shifts to the 50-day moving average, another favorite for assessing trend direction and relative strength. This moving average is currently acting as resistance. If the price of MOBOX manages a close above the level, it would be a sign of the beginning of a new bull phase for the token.
MOBOX chart signals strong bullish momentum
Volume levels play a crucial role in confirming breakouts. In an uptrend, increasing volume always tends to favor additional price appreciation and confirmation of breakout set-ups.
Momentum indicators toward the bottom of the chart, most likely the Relative Strength Index (RSI) or MACD, indicate underlying strength of the market. If these tools show room for additional upside or confirm divergence, they could support the case for sustained gains.
Analysts have placed bullish targets at $0.066, $0.080, $0.097, and $0.140. These targets reflect potential upward swings of 47.6%, 79.0%, 117.0%, and 213.2%. The targets correspond with prior resistance levels or Fibonacci projections popular with technical analysts.
Traders would like to watch the 50-day moving average and price activity near the same while assessing follow-through strength. Setting alerts near the target levels outlined would also assist with entries or exits while MOBOX makes its likely trend reversal.