Ondo (ONDO) has been in the spotlight recently due to price fluctuations. The token shows a potential breakout after a period of consolidation. Recent price movements have prompted attention, as the token has broken free from a descending channel pattern that had limited its price growth for several months.
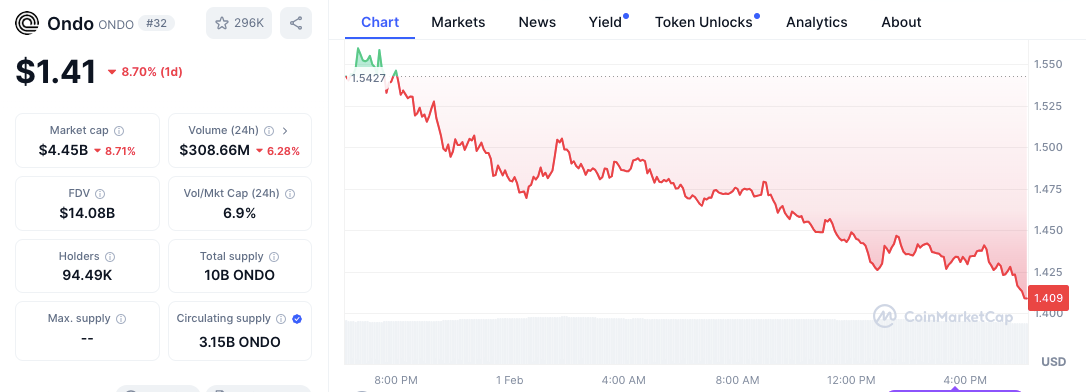
Despite a notable decline in the past 24 hours, the market structure hints at a potential for upward momentum if the price action holds. Currently, ONDO is priced at $1.41, experiencing a drop of 8.7% in its value, with a market cap reduction of 8.71%, bringing it to $4.45 billion.
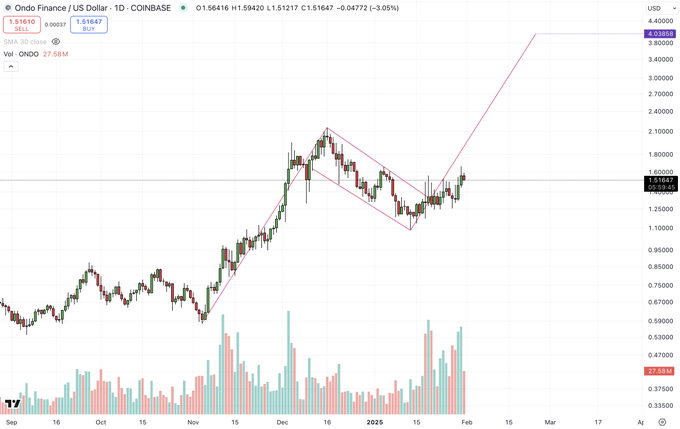
On the daily timeframe chart, ONDO trades within an upward channel. The token has experienced price peaks and retracements, recently breaking out of a descending channel.
This breakout occurred in late January 2025 and has led to a strong upward movement. Volume analysis supports the ongoing bullish momentum, increasing trading volume during the breakout. This is generally seen as a confirmation of strength in the price movement.
The projected target for ONDO in this bullish trend is $4.04. If this target is reached, it would signal a new all-time high for the token. However, market participants should remain cautious of potential volatility as ONDO moves through this key price level.
Volume and market activity
Despite the drop in price and market cap in the last 24 hours, ONDO continues to show relatively active trading. The 24-hour volume-to-market cap ratio stands at 6.9%, indicating that trading activity remains notable despite the decline.
The circulating supply of ONDO is currently 3.15 billion tokens, with a total supply of 10 billion. This drop in market value may be reflective of temporary corrections or broader market conditions, but it’s essential to monitor price action and volume to gauge the strength of this correction.
Bollinger Bands and MACD analysis
Analyzing the 4-hour chart, the Bollinger Bands indicate increased volatility as ONDO’s price approaches the lower band, suggesting the possibility of oversold conditions. The price has fluctuated between the upper and lower bands, with recent touches near the $1.38 mark. A rebound above the middle band at $1.51 could signal a potential bullish recovery.
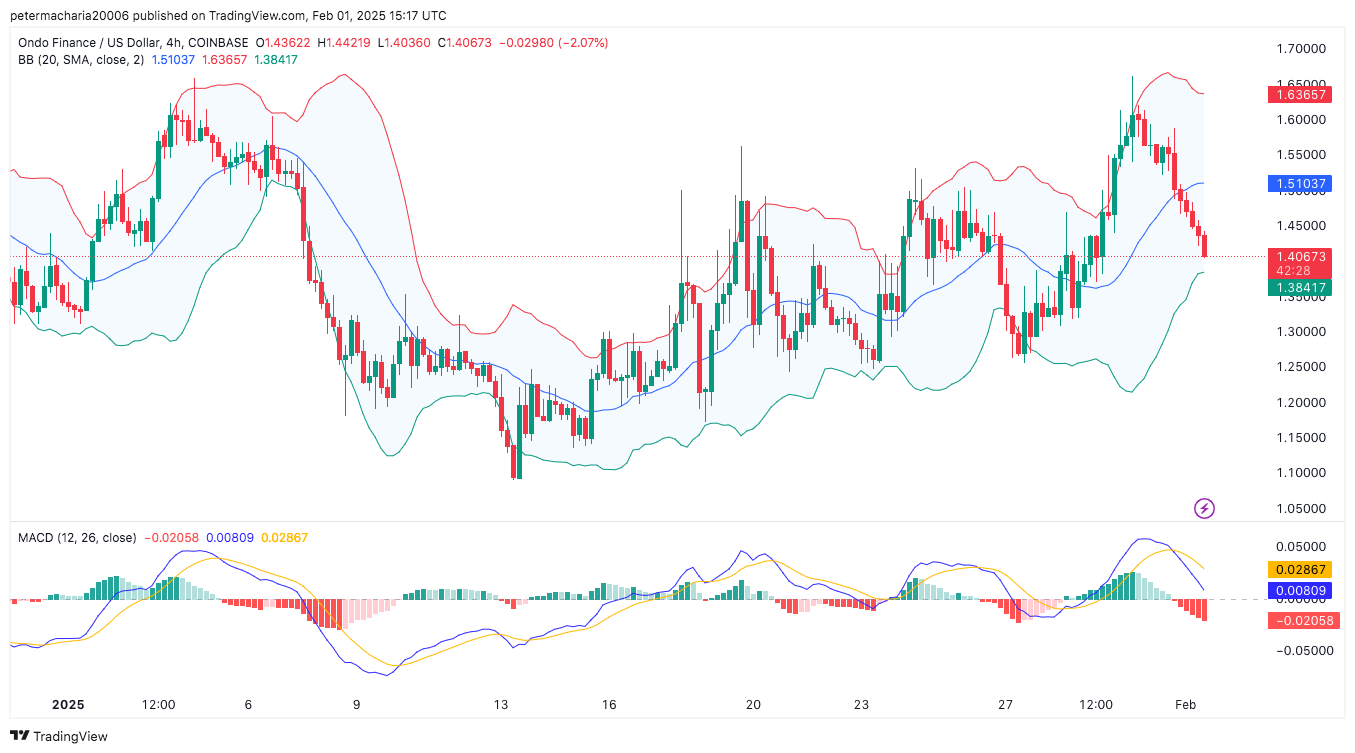
It is positive momentum and the MACD line is above the signal line a sign MACD. Since the green bars of the histogram are already decreasing, that might hint at a weakening of bullish momentum. The positive short term movement is that the current MACD value 0.02867 is greater than 0, however.


