POPCAT’s price chart continues to form consistent upward waves, each wave growing more pronounced since the token’s launch. Price analysis indicates the movement has followed a logarithmic pattern, with each phase building greater strength than the previous one. Current data now points to a possible next leg in the sequence, with expectations of the strongest wave so far forming on the horizon.
Price behavior shows accelerating logarithmic growth
According to an analysis prepared, Bitcoincensus POPCAT’s historical price action reveals multiple waves of growth, plotted across a logarithmic scale. This pattern has maintained a consistent rhythm, with each successive surge exceeding the size and duration of the last. The asset has not broken this sequence since launch, maintaining a steady technical structure.

Logarithmic wave formations often reflect expanding volatility, and POPCAT’s chart continues to align with this price behavior. Technical charting has identified the base of the next wave forming. The recent upward trend has not yet broken the expected trajectory. Data reflects a continuous increase in amplitude, signaling that the next wave may exhibit sharper movement.
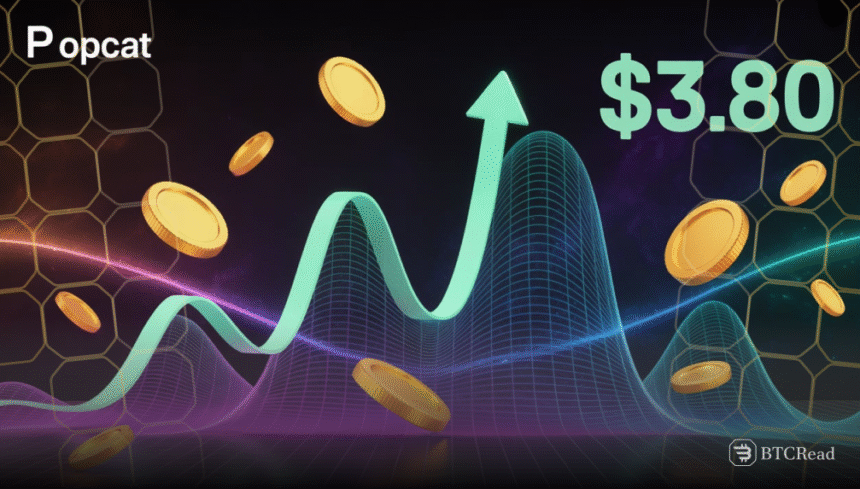
Technical target placed at $3.80
Based on current chart structures, the projected upper limit for this cycle is placed at $3.80. Analysts reviewing POPCAT’s logarithmic performance have mapped the next peak to this level. The price target is based on the same mathematical intervals seen in previous waves. Each breakout has followed a parabolic curve, forming higher highs with sharper ascents.
The $3.80 target reflects the calculated top of the next wave in the ongoing logarithmic sequence. Current chart movement has already started forming the base that typically precedes such spikes. No new trend deviation has been recorded since the last parabolic formation.
POPCAT current market trend revealed
According to CoinMarketCap data, Popcat is trading at $0.4819 after rising 14.05% in the past 24 hours. Market capitalization increased to $472.34 million, reflecting the same percentage change. Trading volume rose 40.37% to reach $244 million.

If the logarithmic progression remains the same, then the next movement is anticipated to outline the peak of the cycle. Historical wave termination points are supported by the analysis of the market structure. The projected target would also be the steepest and last wave in the current series. The chart does not show any break in the formation of the wave but continues following the course by heading toward the upper boundary at $3.80.