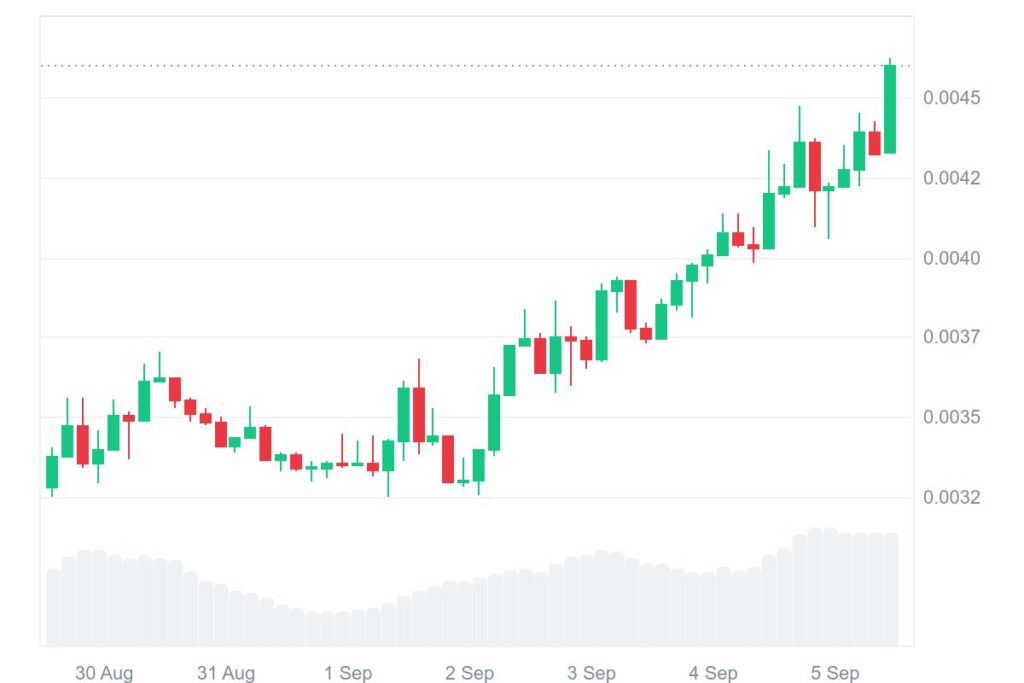
Pump.fun (PUMP) is standing out in the current crypto market, where many major coins are struggling to secure a bullish reversal. Over the past 24 hours, the token has climbed by nearly 7.92%. Looking at the weekly chart, PUMP posted an impressive 38.88% surge.
At the time of reporting, it trades at $0.004574 with a trading volume of $426.01 million, marking a 39.27% increase. Its market capitalization now stands at $1.61 billion, reflecting its growing market presence.
The broader sentiment in the digital asset market is gradually turning from bearish to bullish. While Bitcoin and Ethereum continue to consolidate, PUMP has gained attention by showing relative strength and steady upward pressure. Analysts point out that the token has successfully flipped a major resistance level, setting the stage for potential further gains.
PUMP technical breakout and chart patterns
On the PUMP 4-hour chart, the price has broken above a key supply zone between $0.0038 and $0.0042. This region has now turned into a support base, a sign of strong momentum and positive sentiment shift. The breakout followed a lengthy consolidation phase, with the market structure now forming higher highs and higher lows.
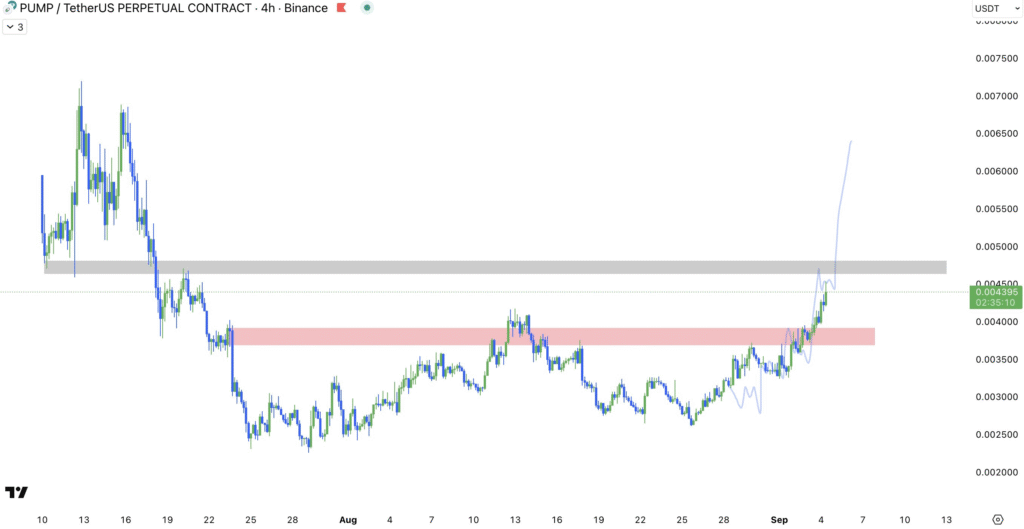
A rounded bottom formation comes into view on the chart, normally a favorable reversal indicator. The next level of resistance is between $0.0048 and $0.0050, the area which acted as good support before the summer breakdown of July. A penetration of the area would likely ease the way down to $0.0060 to $0.0065, equivalent to levels reached during the early summer. But breakdown of the resistance may usher short-term corrections.
Indicators and short-term outlook
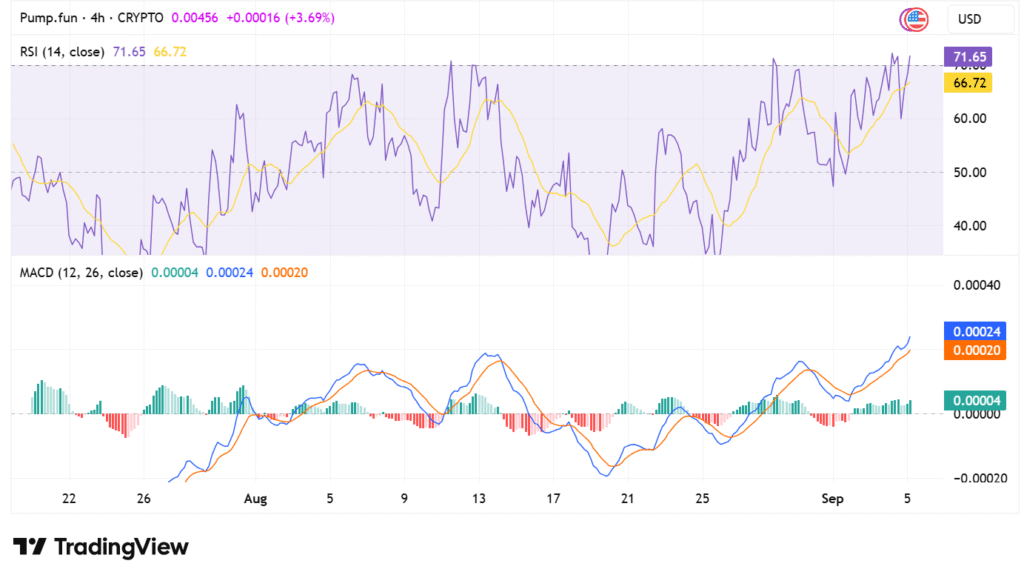
Momentum indicators reveal strong buying interest. The RSI stands at 71.65, which is an overbought level and may result in short-term profit-taking or cooling-off. The MACD indicator remains positive, as the line is still above the signal and the positive histogram is growing.
Despite the risk of shallow adjustments, Pump.fun dominates the market. If the token sustains a lasting upside breakdown above the $0.0050 level, bullish energy could develop and result in more buying pressure, possibly driving new all-time highs.