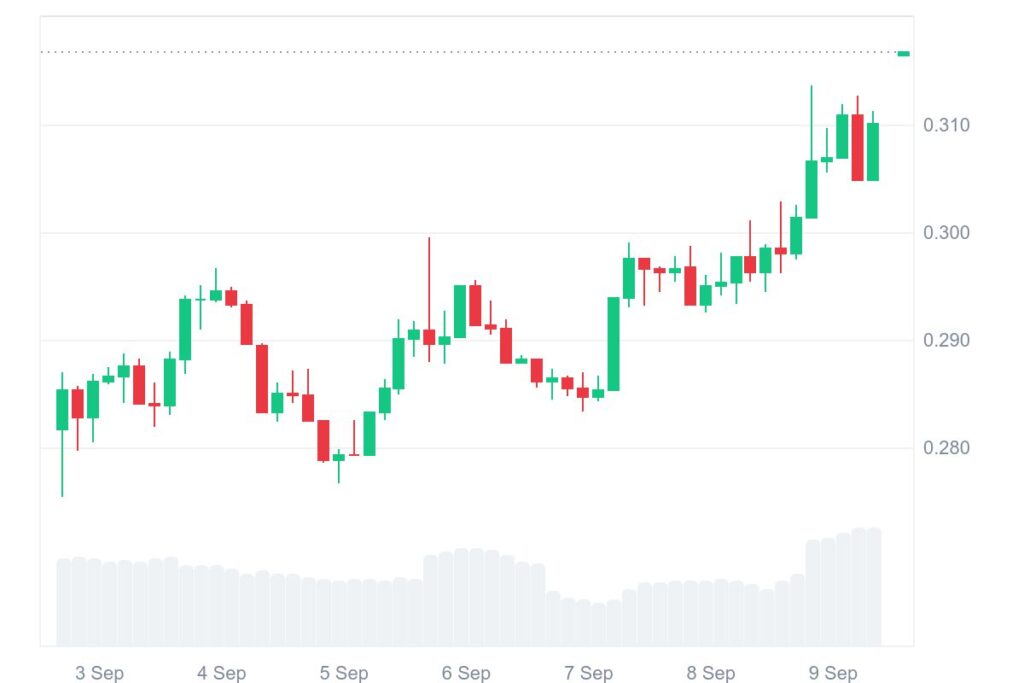
SEI is showing a clear positive trajectory as it continues to rise despite broader market volatility. Over the last 24 hours, SEI advanced by nearly 6.2%, adding to an impressive 12.55% surge over the past week.
At the time of reporting, the token is trading around $0.3167 with a 24-hour trading volume of $239.12 million, marking a sharp 124.56% jump in activity. Its market capitalization now sits at $1.9 billion, strengthening SEI’s position among actively traded cryptocurrencies.
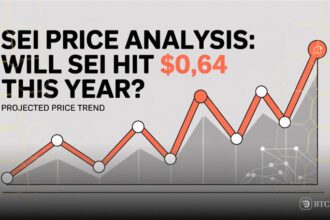
Market interest is concentrated around a crucial resistance point at $0.38, which has emerged as a psychological and technical challenge. A breakthrough at this level could drive momentum toward higher targets, while rejection may trigger consolidation or pullbacks.
SEI resistance levels and market outlook
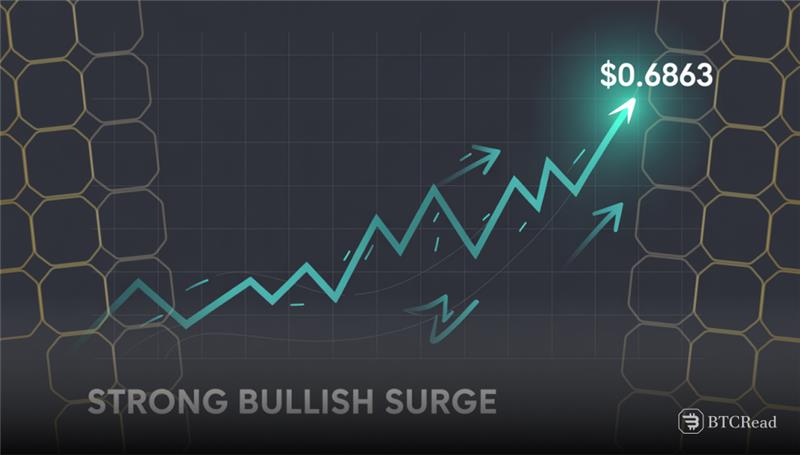
The $0.38 mark holds particular importance as it aligns with the 0.5 Fibonacci retracement level at $0.3864 and the upper boundary of a descending channel. This confluence makes the zone a decision point for traders. Should SEI surpass it, potential targets lie near $0.4995 and later $0.6863, both reinforced by Fibonacci indicators.
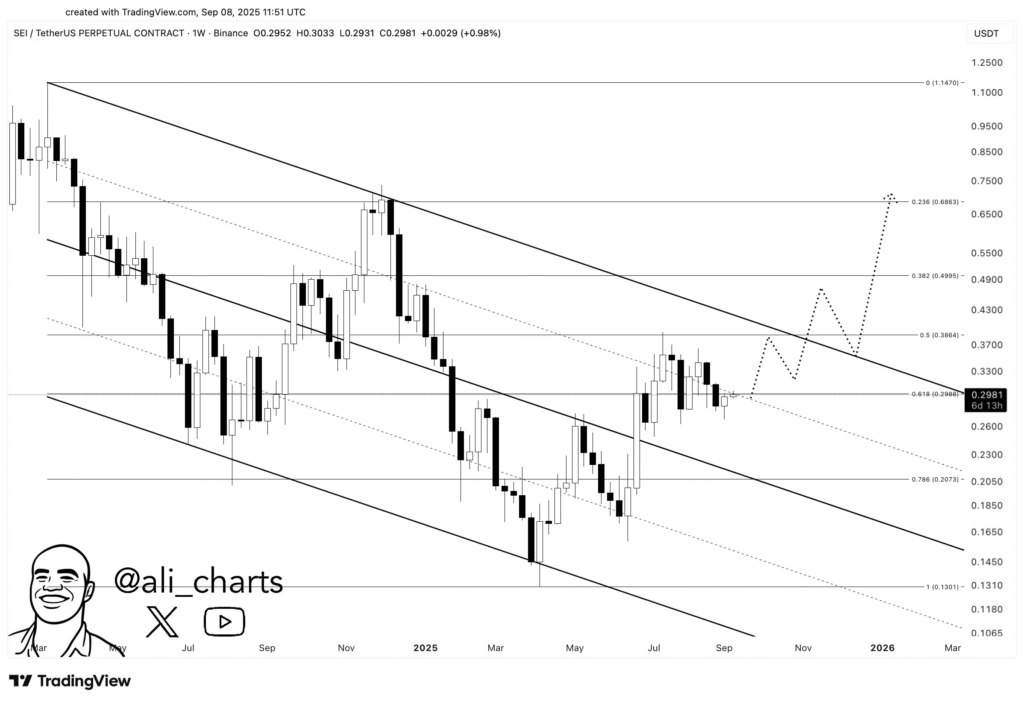
The coin is, currently, being held up at the 0.618 Fibonacci retracement level near $0.3167. If this near-term support doesn’t hold, the decline would then go on to levels near $0.26, $0.23, or even $0.20. The market is closely observing this because the inability to make headway may prolong the current phase of consolidation.
SEI Indicators point to bullish continuation
The technical indicators indicate that the buyers are gaining traction. The Relative Strength Index (RSI) is at 55.56, the point just over the neutral 50 mark that implies growing purchasing momentum. Any further movement in the direction of the 60-70 bracket will be an indication of better bullish morale.
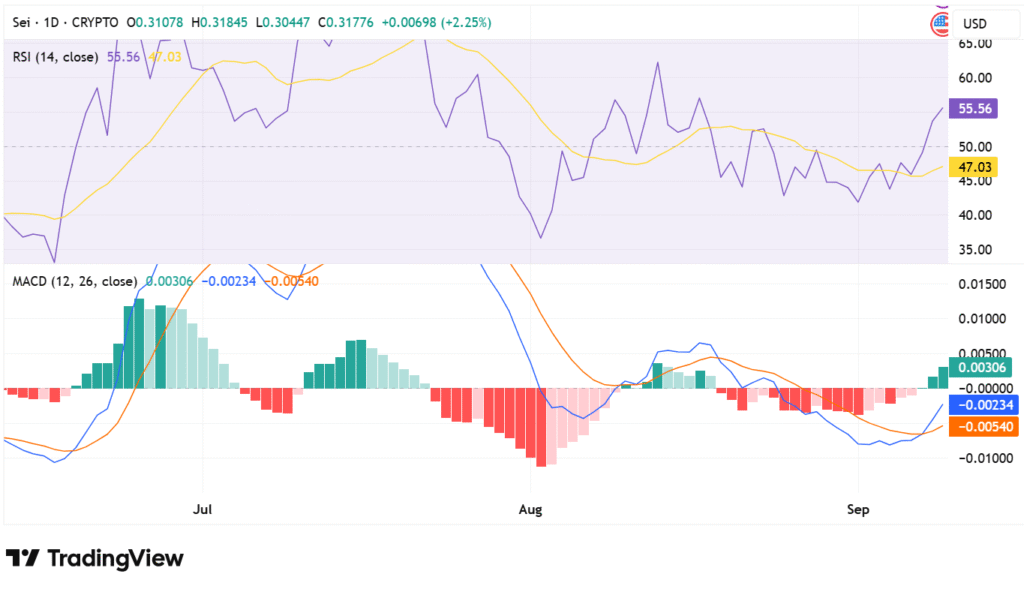
The Moving Average Convergence Divergence (MACD) is also forecasting a bright future. The MACD line at 0.00306 is considerably greater than the signal line at -0.00234 with the help of an expanding and rising histogram. The bullish crossover is the indication of gaining speed that can continue the move in the direction of the $0.38 resistance.
These two meters together foretell a breakout-based market. A breakthrough will justify the reversal of the trend and pave the way toward the upside targets.