SEI is facing sustained pressure as the broader cryptocurrency market shows mixed signals. Over the past 24 hours, the token declined by 2.51%, while its weekly performance reflects a 3.16% drop. At the time of writing, SEI trades at $0.2818 with a 24-hour trading volume of $138.74 million, marking a 6.72% increase from the previous day. Its market capitalization currently stands at $1.68 billion.
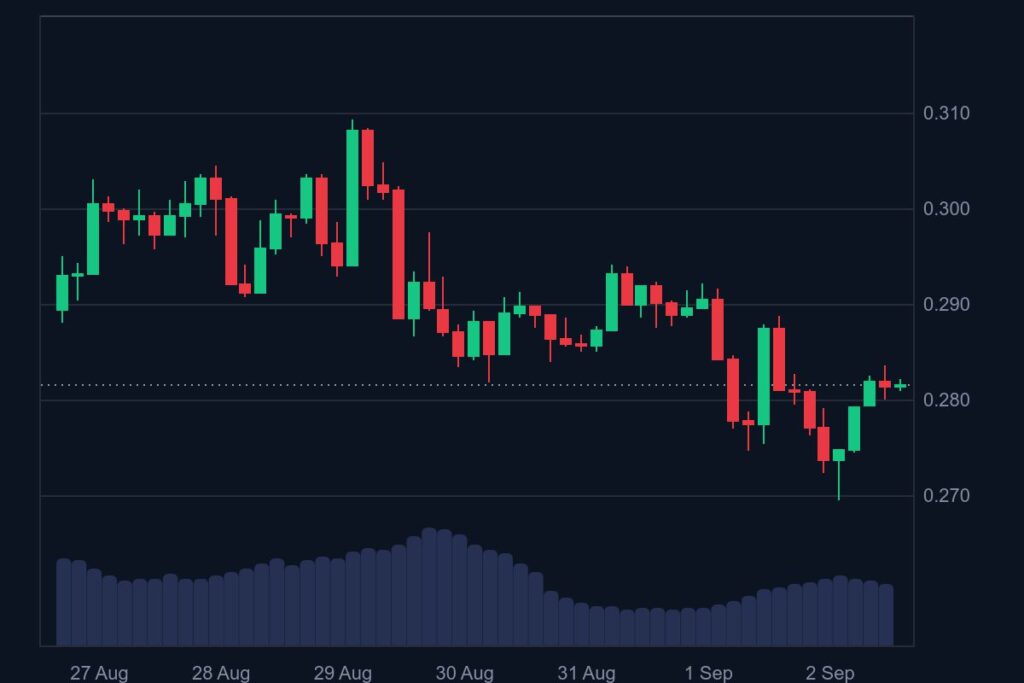
Despite this decline, the increase in trading activity suggests growing investor attention. A closer look at price action reveals that SEI is trading just below $0.2901, a resistance level aligned with the 0.786 Fibonacci retracement. Analysts note that this level will likely determine whether SEI continues its downward path or shifts toward recovery.
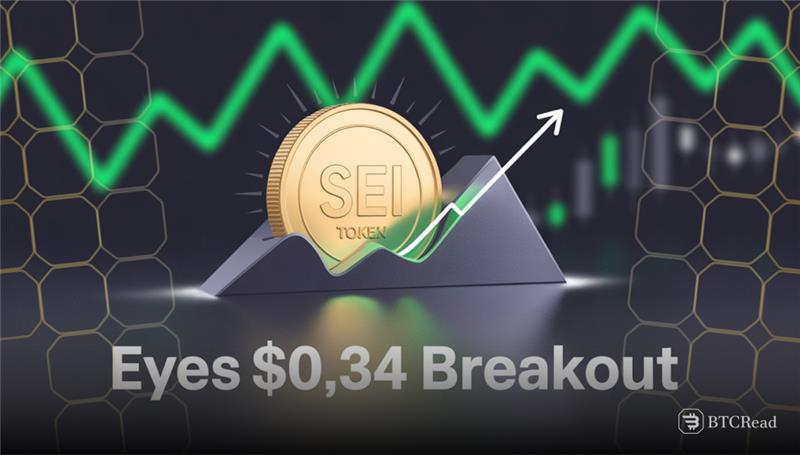
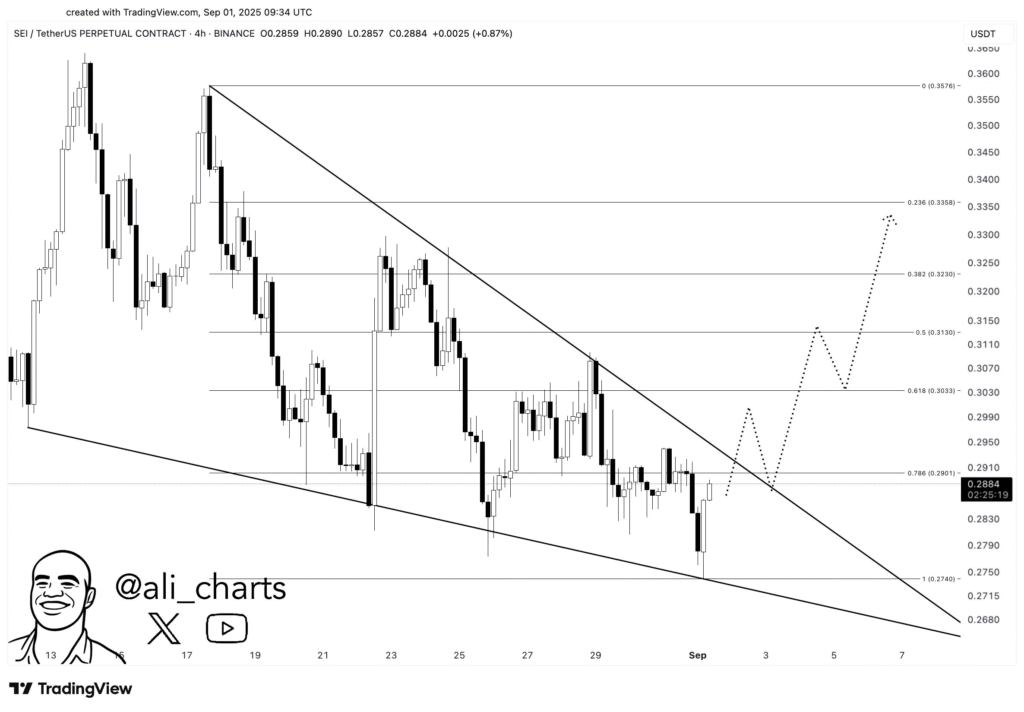
Falling wedge points to sei potential breakout
The chart of SEI/USDT highlights a falling wedge pattern, a formation often seen as a bullish reversal signal. The wedge is defined by two downward-sloping and converging lines, showing that selling pressure may be losing strength. If SEI breaks above the $0.2901–$0.2930 resistance zone, the move could confirm this setup and trigger an upward sequence.
SEI is facing sustained pressure as the broader cryptocurrency market shows mixed signals. Over the past 24 hours, the token declined by 2.51%, while its weekly performance reflects a 3.16% drop. At the time of writing, SEI trades at $0.2818 with a 24-hour trading volume of $138.74 million, marking a 6.72% increase from the previous day. Its market capitalization currently stands at $1.68 billion.
Despite this decline, the increase in trading activity suggests growing investor attention. A closer look at price action reveals that SEI is trading just below $0.2901, a resistance level aligned with the 0.786 Fibonacci retracement. Analysts note that this level will likely determine whether SEI continues its downward path or shifts toward recovery.
Falling wedge points to sei potential breakout
The chart of SEI/USDT highlights a falling wedge pattern, a formation often seen as a bullish reversal signal. The wedge is defined by two downward-sloping and converging lines, showing that selling pressure may be losing strength. If SEI breaks above the $0.2901–$0.2930 resistance zone, the move could confirm this setup and trigger an upward sequence.
Predicted levels of resistance are $0.3033, $0.3130, $0.3230, then $0.3358, which corresponds to the $0.34 target. A breakout to this level would be a 16% rise higher from current levels. Chart history is behind this projection since downtrending wedge breakouts tend to have good followthrough to the upside. A failure to remain above $0.2901 could put the move on hold or out of reach, while a move below $0.2740 could send SEI to $0.2680.
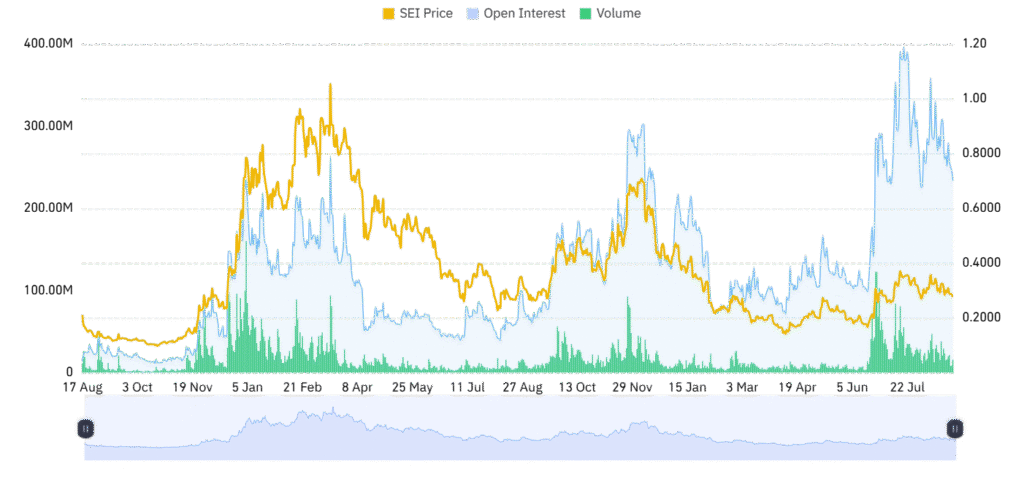
Derivatives data signals reset, not weakness
Other than price charts, these metrics suggest a corresponding shift in derivatives. Open Interest has gone down 3.47% to $240.28 million, suggesting traders closing levered positions. Such a move tends to act as a market reset, liquidating overly levered trades to accommodate a sustainable trend.
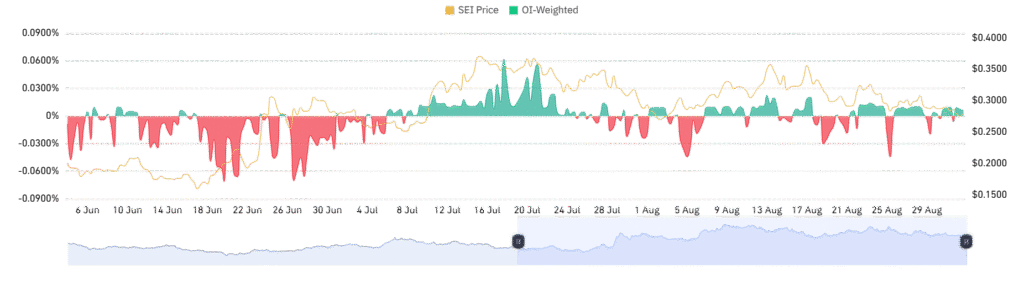
Contrarily, OI-weighted financing stands at +0.0057%. That modestly positive but even level signifies a neutral mood wherein longs or shorts aren’t in control. Along with Open Interest’s decline, both indicators usually signal a big directional shift subsequently. Traders watch anxiously for confirmation of the breakout now.
Derivatives data signals reset, not weakness
Other than price charts, these metrics suggest a corresponding shift in derivatives. Open Interest has gone down 3.47% to $240.28 million, suggesting traders closing levered positions. Such a move tends to act as a market reset, liquidating overly levered trades to accommodate a sustainable trend.
Contrarily, OI-weighted financing stands at +0.0057%. That modestly positive but even level signifies a neutral mood wherein longs or shorts aren’t in control. Along with Open Interest’s decline, both indicators usually signal a big directional shift subsequently. Traders watch anxiously for confirmation of the breakout now.