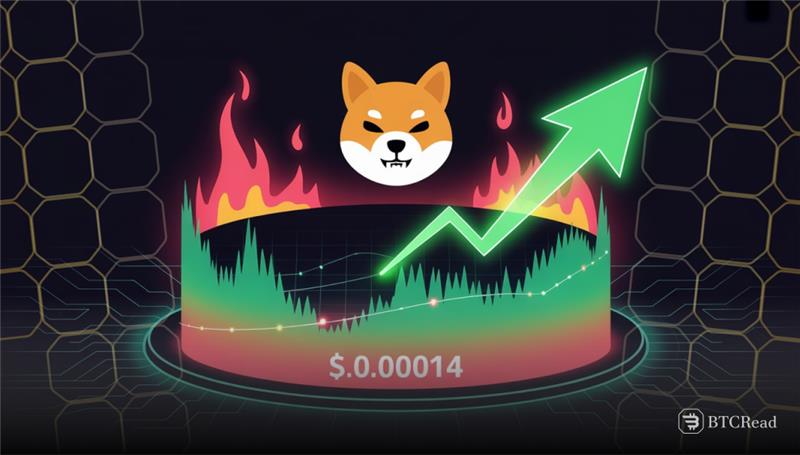
Shiba Inu’s price has struggled in 2025, down nearly 12% year-to-date, while major cryptocurrencies trade in green. For the past 30-day interval, the cryptoasset lost 18.1%, including the past week’s losing 6%. At the time of press, the memecoin trades close to $0.0000123.
On the 4-hour timeframe, SHIB is still within a declining channel. The higher trend line has not been retested, which indicates bulls are in need of decisive action. The first support level is $0.000011, which, if violated, may continue the ongoing correction, challenging weaker areas below.

Critical resistance levels for bulls
To ignite bullish momentum, SHIB must clear the $0.000013 resistance, aligning with the 0.236 Fibonacci retracement. A break above the area may spark higher targets. Buyers will also be watching the 0.618 golden ratio of $0.000014 for evidence of continued upside pressure.
If bulls breach $0.000014, the memecoin could rally toward $0.000016, creating a swing high. The next potential target might reach $0.000019, although such gains would require intense buying pressure. Current market sentiment and low demand make these levels difficult to achieve at present.
Whale activity remains a strong predictor of the short-term future of the SHIB. Details show the largest holders, the wallets of 100 million to 1 billion SHIB, are closing positions. Between July 21 and July 28, the positions reduced slightly, prompting a strong 14.29% correction of the price from $0.000014 to $0.000012.

Shiba Inu faces resistance near $0.00001269
As of August 21 whale positions moved even lower to 17.33 trillion SHIB, trading $3.7 million. The decline in an already weak trend sets the stage potentially for subsequent corrections, assuming the selling continues. Lower confidence by the whales may break key areas of support during subsequent sessions.
Glassnode’s cost-basis distribution heatmap shows accumulation levels where SHIB is most supported. Approximately 19.99 trillion worth of SHIB coincides with around $0.00001212, serving as a significant support area. In the August 19 correction, the area held the price from sliding lower, underlining the significance of the area.

Resistance lies around $0.00001269, where about 11.83 billion SHIB are stacked. SHIB has consistently been unable to break through this range, indicating ongoing selling pressure. A fall through $0.00001211 may induce one more sell wave, supporting the pressure identified by the heatmap distribution.