Shiba Inu (SHIB) is on the way to its positive price trajectory and is experiencing a surge in its value, in accordance with the general market status. Currently, the SHIB is moving inside a descending triangle pattern, which often leads to a bullish reversal. Traders and investors are closely monitoring SHIB in order to compensate for losses from the recent volatility.
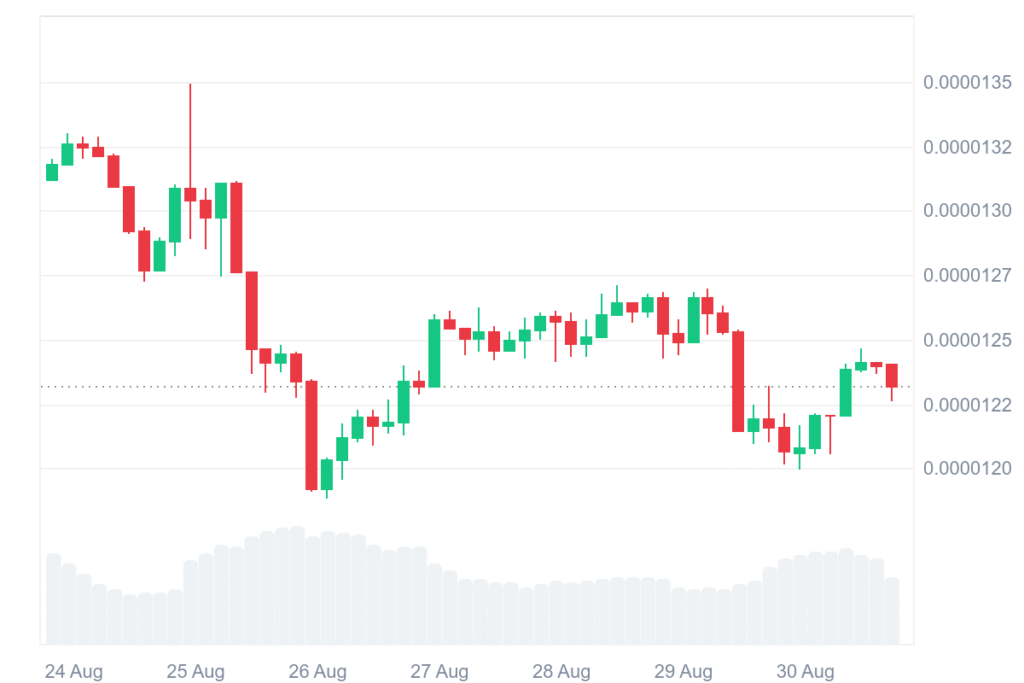
At the time of writing, SHIB is trading at $0.00001231 with a 24-hour trading volume of $210.87 million and a market capitalization of $7.25 billion. The SHIB price over the last 24 hours is up by 1.11%, but over the last week it is down by 6.79%.
Shiba Inu targets $0.000025 after channel break
Moreover, the crypto analyst, Jonathan Carter, highlighted that Shiba Inu (SHIB) has officially broken out of a downward channel pattern that has kept the price from gaining upward momentum in the past few weeks.
The move is a confirmation of a change in market sentiment and has attracted keen attention from traders awaiting the next big move. The breakout is also a result of a period of stabilization, and it is likely that market players are getting ready for increased volatility. With momentum slowly but surely gaining strength, many investors are therefore already speculating that SHIB may be in the initial phases of a new bull cycle.
Currently, SHIB is consolidating just below the 50-day moving average (MA 50) in the daily chart. We consider it a primary region of resistance, and a successful breakout through it could pave the way upwards for stronger positive momentum. Historically, a successful retaking of this moving average has been a consistent harbinger of midterm upward movements in the token price action.
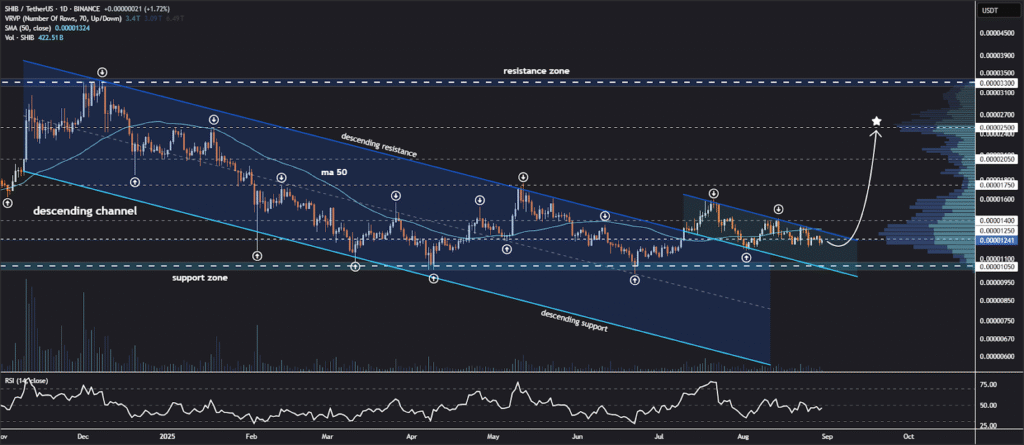
If the breakout is maintained, technical predictions identify potential upside objectives at $0.00001400, $0.00001750, $0.00002050, and $0.00002500. All of them are places where profit-taking or a new round of buying demand might emerge and are critical checkpoints in SHIB’s future rally. However, being unable to hold above support might negate the bullish pattern.