In a recent X post, the Moon Show highlighted that despite Shiba Inu’s recent correction. The token still ranges within an ascending triangle on the weekly chart.
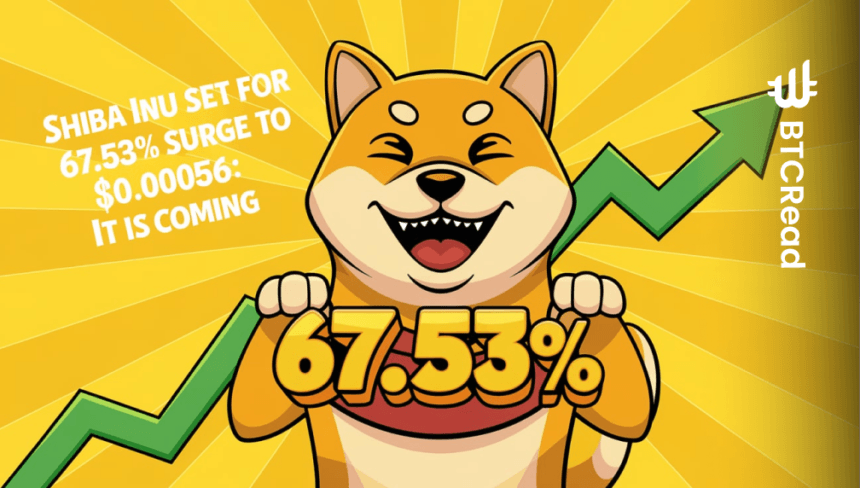
The analysis suggests a conservative target price of $0.000056, predicting a potential surge of about 67.53% if the price breaks above the current resistance level.
Ascending triangle: A breakout in the making?
Despite the recent downturn, Shiba Inu’s chart shows an ascending triangle pattern, which is typically a bullish formation. The pattern is characterized by a rising support trend line from late 2023 to mid-2024 and a horizontal resistance level.

This formation suggests the potential for a breakout above the resistance level, which could lead to a price surge. According to the Moon Show’s analysis, a breakout could result in a price increase of about 67.53%, targeting a price of $0.000056.
However, the validity of this breakout depends on market conditions and investor sentiment, as the pattern could still evolve in various ways.
Shiba Inu Current market conditions and technical indicators
As of Dec. 26, 2024, Shiba Inu was trading at $0.00002167, experiencing a 7.58% decline in the past 24 hours. The token’s market capitalization stands at approximately $12.76 billion, with its trading volume decreasing by 25.55%, now at $547.43 million.
This indicates a drop in market activity and investor participation. The price has been in a steady downtrend since Dec. 25, 2024, signaling reduced momentum in the market.

Moreover, the volume-to-market-cap ratio (Vol/Mkt Cap) of 4.33% highlights the lack of significant trading volume, suggesting that the market for Shiba Inu is currently less active.
Looking at the technical indicators, the Relative Strength Index (RSI) for Shiba Inu is currently at 40.76, which places the token in the bearish zone. It is below the neutral level of 50, suggesting that SHIB faces downward pressure.
However, based on the RSI, it is currently slightly below the middle line and moving closer to the oversold point, which, if breached, could mark a short-term reversal.
If the RSI drops below the 30 mark, it might suggest that the token is oversold, opening up a potential purchase signal. However, if the RSI continues to move lower, SHIB can experience a further dive in the short term.

The Moving Average Convergence Divergence (MACD) indicator also reflects a bearish sentiment for Shiba Inu. The MACD line (blue) is below the signal line (orange), marking a bearish crossover. This suggests that the momentum is skewed to the downside.
Also, observing the histogram and the series of decreasing negative figures it displays, the outlook is bearish. The relationship between the MACD and the price suggests that continued bearish pressure is being applied. The token suggests Shiba Inu could further drop in the short run.


