
Solana’s recent price movement has caught the attention of traders and investors alike, as the coin is currently trading at $191.80, showing a decline of 3.33% over the past 24 hours. After peaking at $202.59 earlier in the day, Solana faced a sharp decline, reflecting significant volatility in the market.
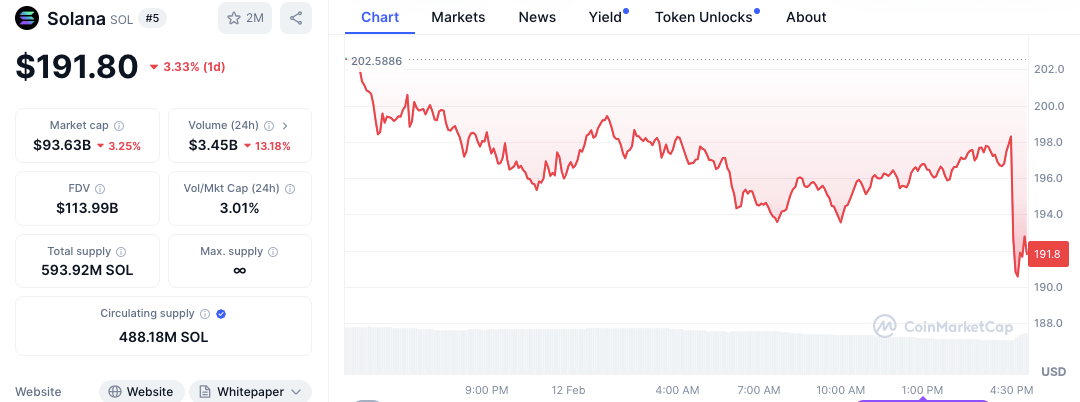
With a market capitalization of $93.63 billion, Solana continues to hold a dominant position, but its future trajectory will largely depend on whether it can maintain support at current levels or face further downward pressure.
Solana’s price fluctuations have created a volatile environment for traders. Between Jan. 25 and Feb. 8, 2025, the price of SOL oscillated between $190 and $240. This period has highlighted the danger for traders holding leveraged positions, particularly as the price nears critical points.
A key moment in this price action occurred when Solana touched $245.58, triggering a surge in liquidation leverage to $11.35 billion, signaling a potential disaster for those in short positions. As Solana moves between these price points, the intensity of leveraged positions increases.
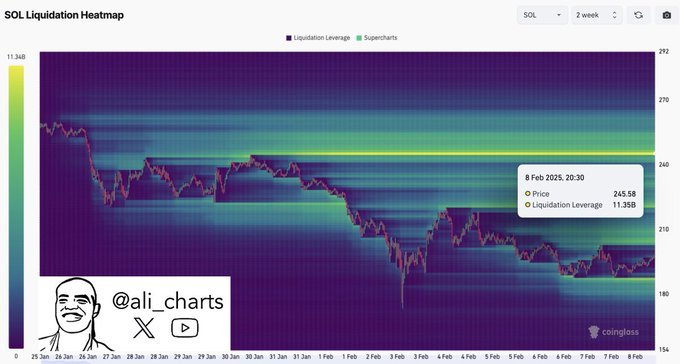
When the price nears $245, there is a heightened risk of cascading liquidations, creating a volatile market environment. Traders must keep a close watch on these fluctuations, as even minor price changes can lead to liquidations, intensifying market pressure.
Market trends and trading volume
Solana’s market performance has been a mixed picture in recent days. Despite its strong market capitalization, the trading volume has decreased by 13.18%, dropping to $3.45 billion. This reduction may indicate a market correction or a slowdown in activity as traders take a wait-and-see approach after the sharp price movement earlier.
With a circulating supply of 488.18 million SOL and 593.92 million, Solana’s fully diluted valuation stands at $113.99 billion. This theoretical market cap reflects the value of all tokens in circulation, showing the substantial potential for price changes as more tokens enter the market.
Solana technical indicators point to bearish momentum
The short-term technical outlook on Solana is bearish and can be accessed from the technical indicators. The MACD is currently negative at -4.69, which means that the MACD line, which is below the orange line, suggests selling pressure. The histogram, indicating the intensity of this pressure, also remains negative at -7.70. These indicators signal that Solana could continue its downward trend without a reversal.
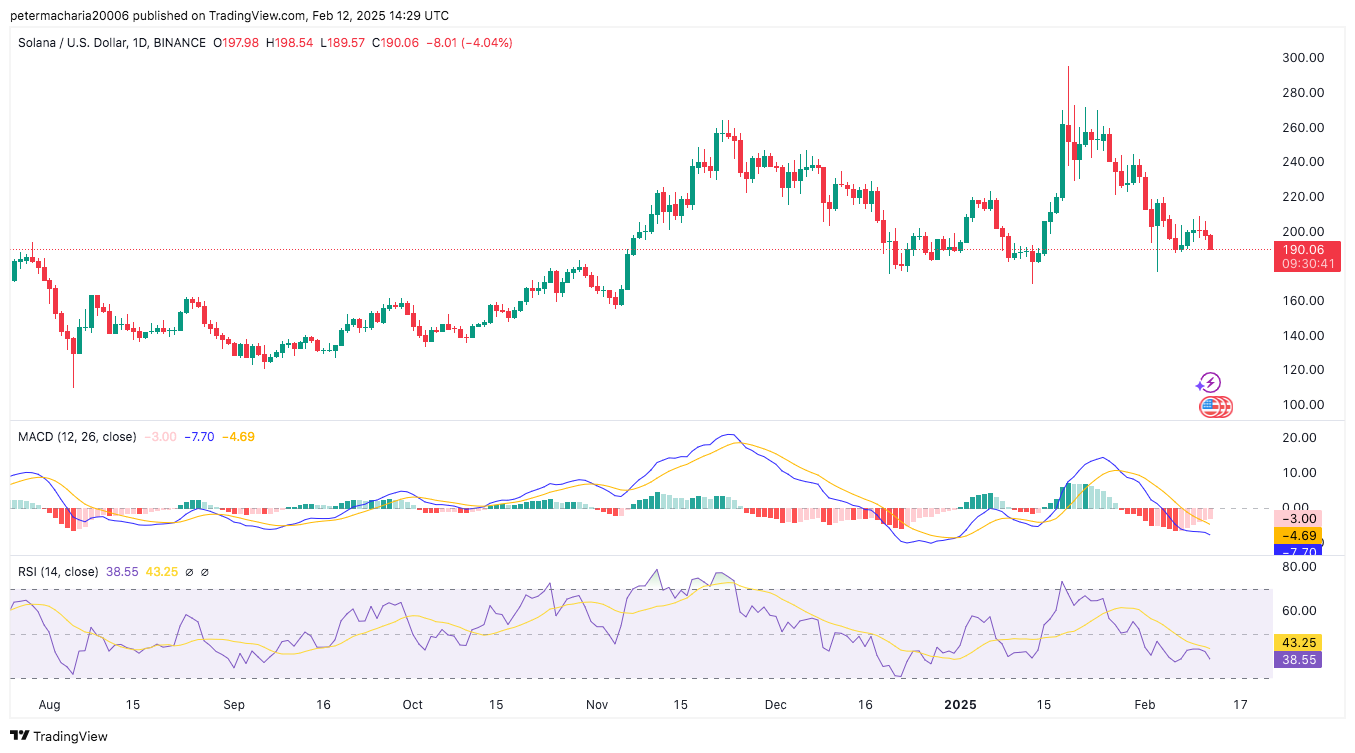
Also, the Relative Strength Index (RSI) is 43.25, located in the middle of the indicator, which means the selling pressure will persist. As for the Solana price, while Solana is far from being oversold, the RSI drop might bring the asset closer to the ‘oversold’ range if the trend reverses.


