Solana has experienced market turbulence, with its value dropping by 50% from its January peak of $295. This decline follows reduced trading activity in meme coins that previously fueled its surge. Platforms like Pump.fun boosted Solana’s rise, generating 8.1 million tokens and collecting $577 million in fees. Solana’s daily trading volume peaked at $218 million on February 12.
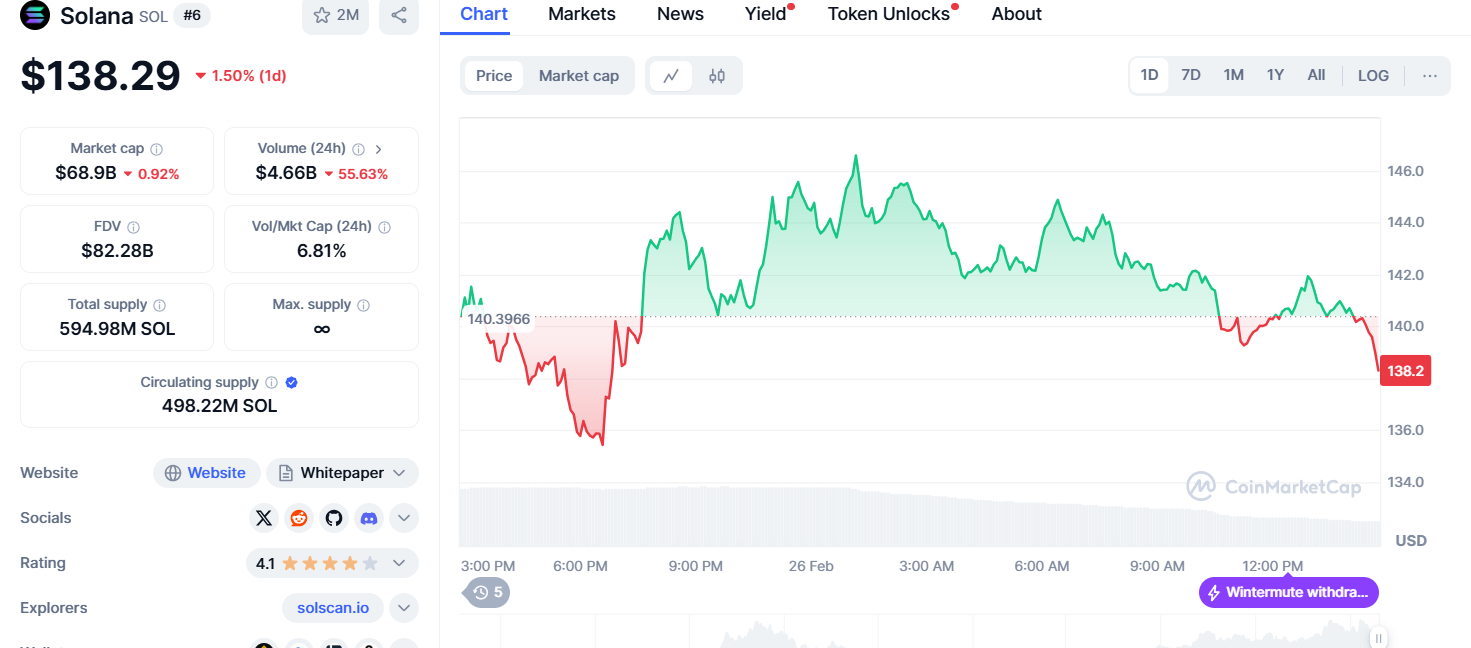
Solana is priced at $138, reflecting a 1.50% decline in the past 24 hours. The 24-hour trading volume decreased by 55%, indicating diminished market activity. With a market cap of $68.9 billion, Solana struggles to regain upward momentum after failing to break the $145.00 resistance level, highlighting ongoing market uncertainty.
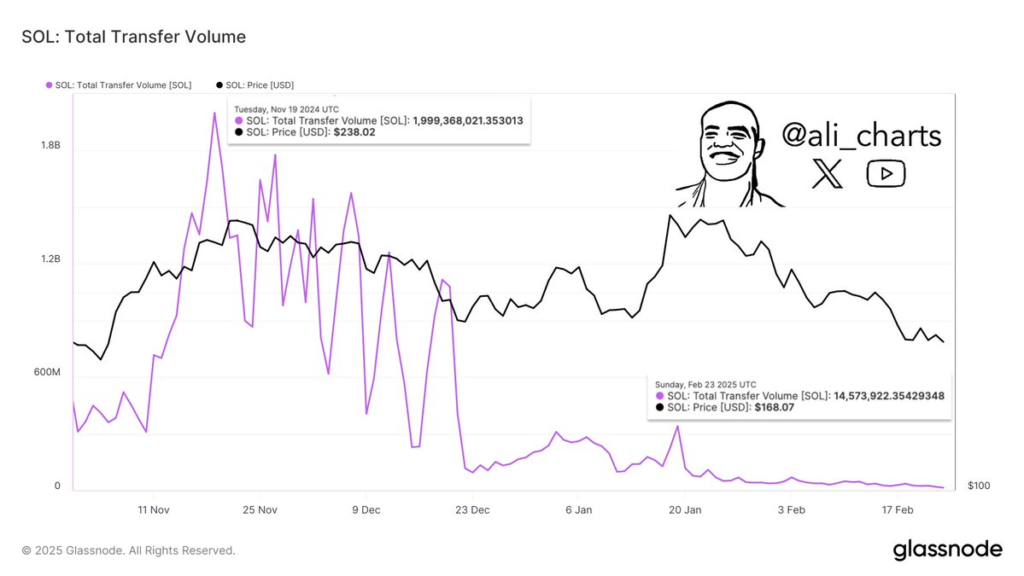
Solana network activity drops as transfer volume falls by 99%
Beyond price volatility, Solana’s network metrics reveal concerning trends. According to analyst Ali, Solana’s total transfer volume dropped sharply from $1.99 billion on November 19, 2024, to just $14.57 million by February 23, 2025. This staggering 99% decline reflects reduced user activity and declining investor confidence. During its peak, SOL traded at $238, driven by strong network engagement.
Several factors contribute to this downturn. The rise in Solana-themed meme coins led to a surge in pump-and-dump scams, with the LIBRA token scam being particularly impactful. As a result, the market cap of meme coins linked to Solana dropped from $25 billion in January to $8.6 billion. Additionally, declining gas fees, lower decentralized exchange (DEX) volumes, and fewer active addresses highlight broader ecosystem concerns.
Solana price targets $170 if $120 support holds
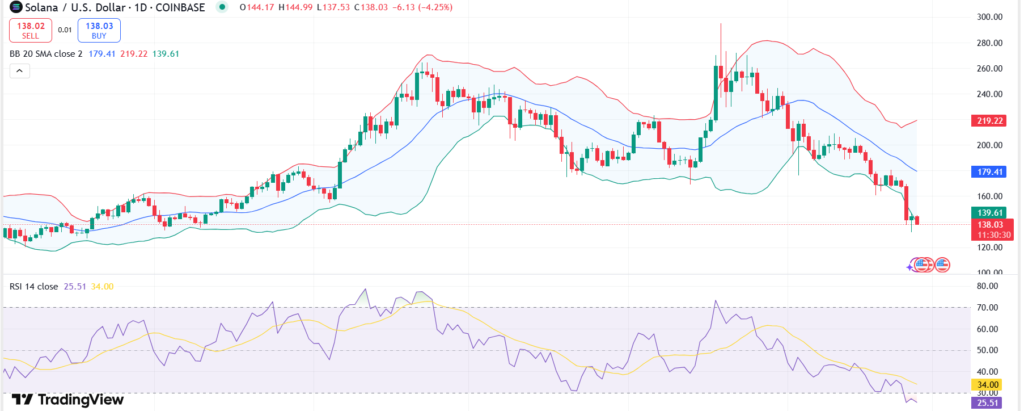
Despite the bearish outlook, there are signs of potential recovery for Solana. Analysts note that holding the $120-$140 support range is crucial for a rebound. Should SOL maintain this level, it may target the $170 resistance.
The Bollinger Bands (BB) show heightened volatility, with SOL trading below the lower band at $139.61, signaling oversold conditions. The 20-day SMA at $179.41 serves as immediate resistance. A breakout above this could push prices toward $200.00 and potentially $219.22.
The relative Strength Index (RSI) sits at 25.51, indicating oversold territory, which could lead to a short-term bounce. Key support zones lie at $130 and $120, while resistance levels are at $139 and $179. Failure to hold $130 could lead to further declines, but reclaiming $179 is essential for a sustained recovery.