Solana (SOL) has broken out from a “cup-and-handle” pattern, a bullish setup that could signal price gains. The pattern formed between Sept. 2022 and early 2024 suggests that Solana could surge to an all-time high of $4,700.

This price target comes after the cryptocurrency completes its cup phase and nears the handle phase. Analysts are closely watching for a break above the key resistance level of $220. If this breakout occurs, it could start a major rally for the blockchain network’s native token.
Solana (SOL) price surge and market movement
Over the past 24 hours, Solana has seen a price surge of 17.89%, reaching $256.72. This sharp increase comes after a period of steady growth. The token’s price rose from $217.94 to its current value. This rapid price movement suggests that investor interest is accelerating, particularly given the token’s market capitalization of $124.91 billion.
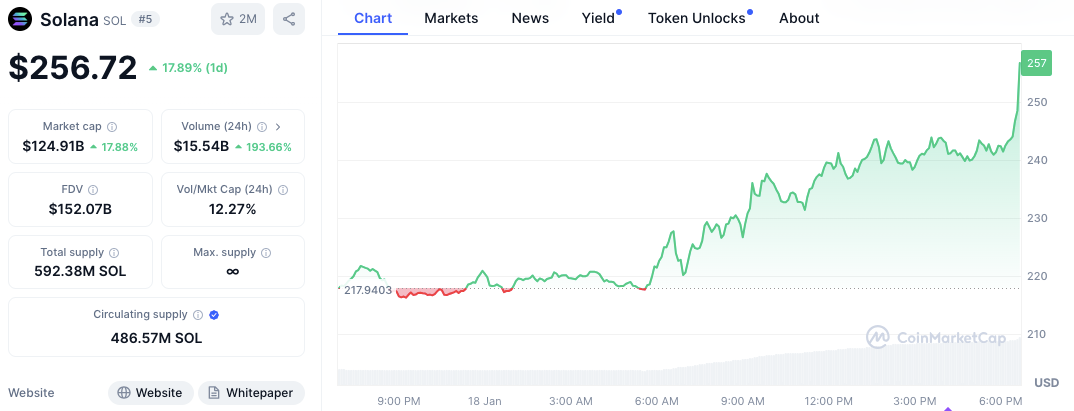
Furthermore, the price action has escalated, with the trading volume rising by 193.66% to $15.54 billion. Such a considerable increase in the volume of trades means that both retail and institutional buyers since it signals that there is strong demand for Solana at this price.
RSI and MACD indicators: Strong momentum with caution
The RSI currently stands at 76.02, indicating that Solana is overbought territory. An RSI value above 70 generally indicates a short-term pullback, as the asset may be due for a correction or consolidation.
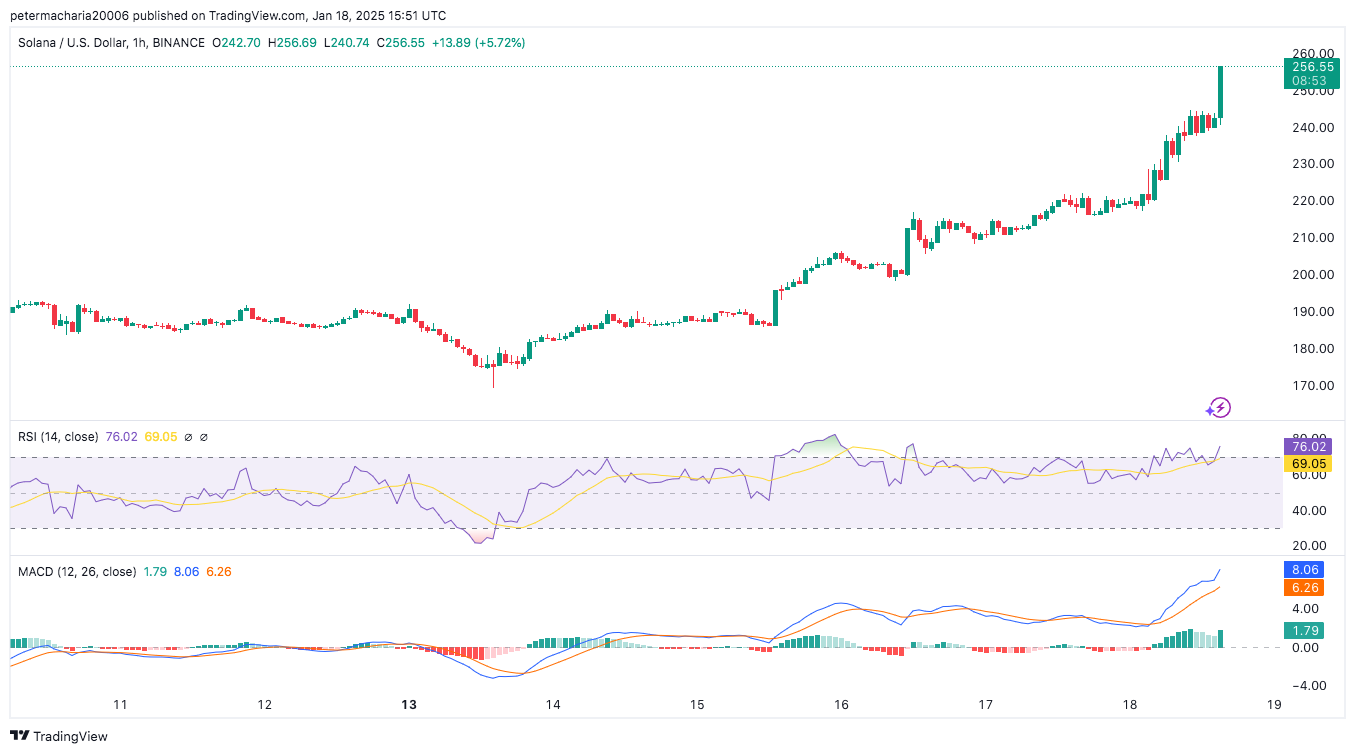
However, MACD is again a bullish one and the MACD line is placed at 1.79 and the signal line at 6.26. The spread between these two lines the anticipate the strong bullish trend, while the positive histogram add credibility to the notion that buying pressure is likely to persist in the near term.