Solana (SOL) is currently trading at $147.30, accompanied by a 24-hour trading volume of $2.59 billion across global exchanges. The total market capitalization now stands at $77.77 billion, placing Solana among the top blockchain assets by valuation.
Despite slight fluctuations during the day, the token’s price remained stable with minimal downward or upward movement over the last 24 hours. Solana registered a 1.30% gain over the week and seems to be exhibiting initial signs of new buying sentiment by traders.
Investors are cautiously taking notice of the emerging chart configuration that is ascending and seeks to end a correction phase. Technical analysts believe that it can propel Solana to yet another strong bull wave within the immediate term.
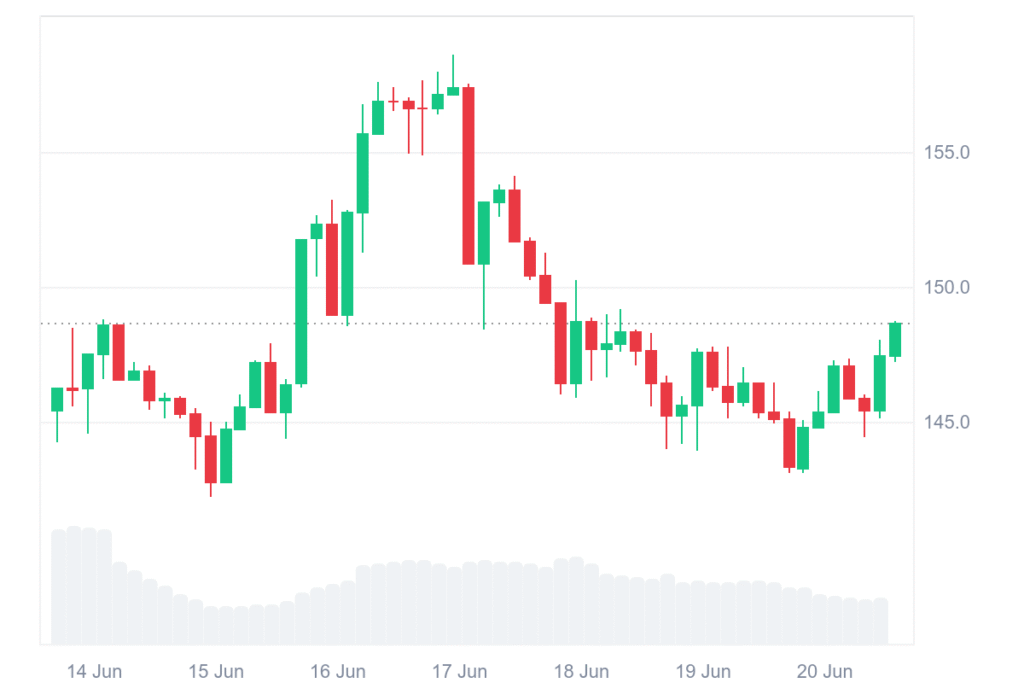
A detailed 1-day candlestick chart shared by trader @CryptoBullet1 outlines three important price zones that help to better conceptualize the ongoing trend.
Zone A, within $150 and $160, was the latest local top formed before dropping into a correction trend. Zone B, within $120 and $130, was the trough formed during the latest bearish correction.
Solana technical chart hints at upcoming surge
The formation of a rounded U-shape from Zone A to Zone B reflects an accumulation phase as buying volume begins to return. Analysts view this pattern as a strong technical indicator of buyer interest gathering at lower levels.
A red arrow pointing upward from Zone B to Zone C suggests a potential price move. This projection targets the $220–$250 range. This is also comparable to market strategies including Elliott Wave Theory, where cyclical patterns for asset values are identified through the sentiment of the investors.
Community traders such as @TahmidKabir9 and @PPowell8986 have also expressed optimism regarding the immediate-term bullish trend.
Despite the bullish outlook, some caution is warranted. Experts at TradingView highlight potential resistance between $163.80 and $170. Traders should wait for volume and breakout confirmations before significant decisions.