
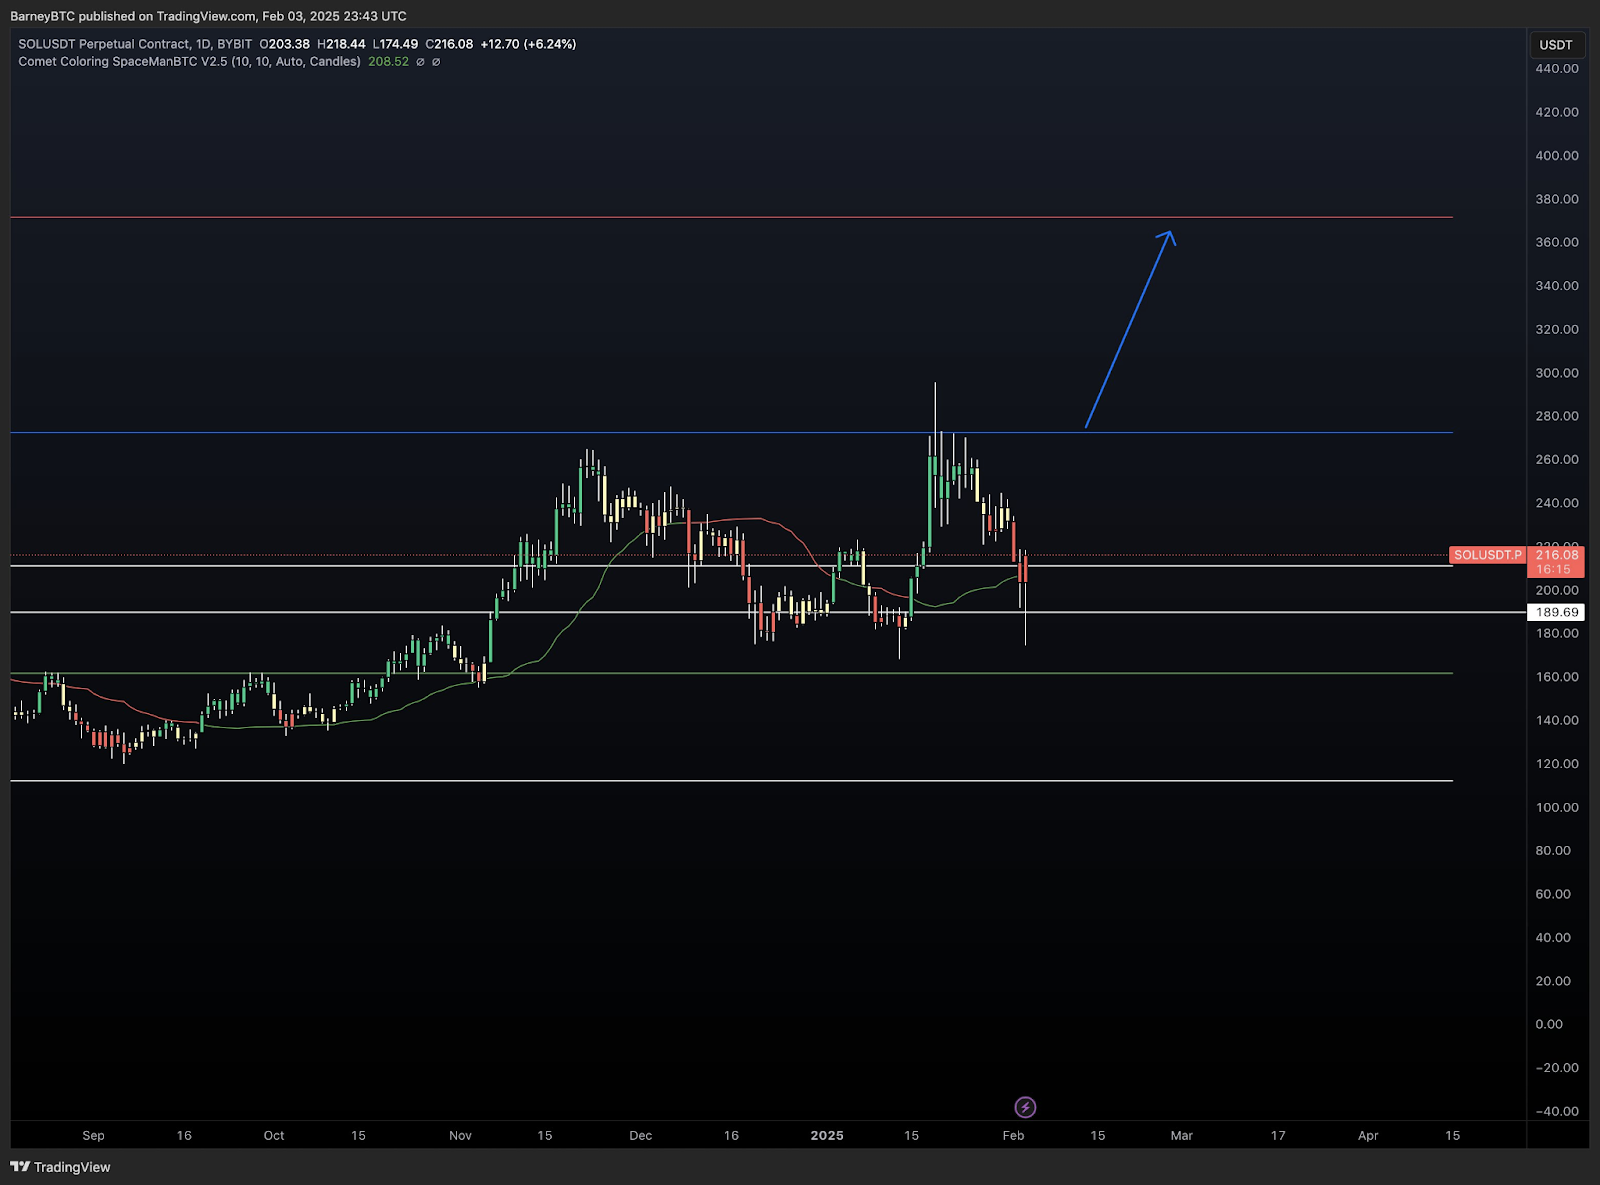
Solana (SOL) has become one of the most appealing cryptocurrencies in the market, catching the attention of traders and investors alike. Following a brief surge in mid-January, the token has retraced to a critical support level of $190.00 USDT.
However, there is an opportunity for a potential long entry because of this drop. Traders are closely watching for signs of a further advance toward higher price targets, with some forecasting a move toward $380.
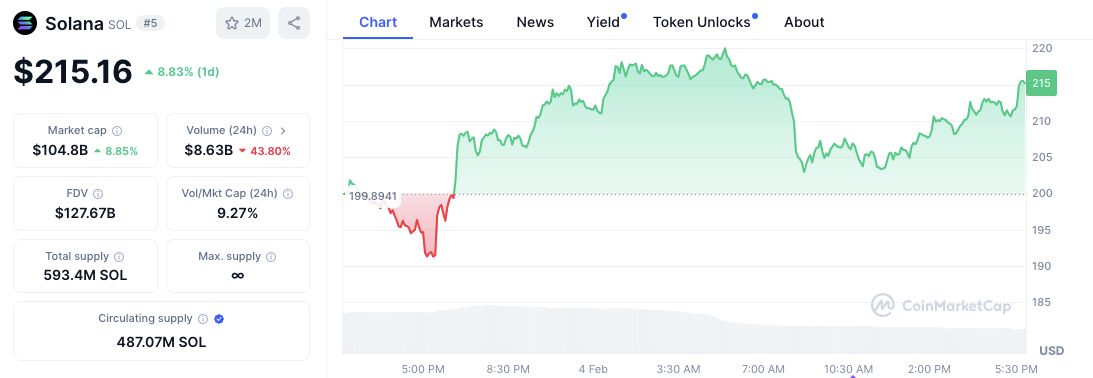
Solana’s price has recently been steadily rising, hovering around $215.16. After dipping to $199 in recent days, the cryptocurrency has recovered with an 8.83% increase in the last 24 hours. Traders closely monitor key support and resistance levels at the root of this potential bullish rally.
The critical support zone is $190.00 USDT, where the price has found support during previous dips. The level has proven to be a strong floor, offering traders a potential entry point for long positions. On the other hand, the resistance zone above $240.00 USDT is a crucial barrier to watch. A break above this level could continue the current trend, potentially propelling the price toward $360.00 USDT.
Market sentiment and future outlook
Despite a 43.8% decrease in trading volume over the past period, Solana has continued to show resilience. Solana’s fundamentals remain strong, with a market capitalization of $104.8 billion and a circulating supply of 487.07 million SOL tokens. However, the decreased trading volume may indicate a slowdown in momentum, which traders will need to watch closely.
While the current bullish trend is closely monitored, the market sentiment is still cautious, with mixed signals from the technical indicators. Traders should keep an eye on the critical resistance and support levels, with the potential for a breakout above $240.00 USDT or a dip below $200.00 USDT as key points to watch for a clearer directional move.
Solana’s journey towards the target of $380 hinges on how it performs in the coming weeks, with traders expecting volatility and opportunities for further gains.
MACD and RSI Analysis: Signs of consolidation
The technical indicators of Solana show mixed signals in MACD (Moving average convergence divergence). Here, the MACD line is above the signal line but near-zero level, and the histogram is decreasing.
This implies that bullish momentum may come to an end and that a consolidation stage may begin. If the MACD crosses below the signal line, there may be a bearish reversal situation; traders should be careful.
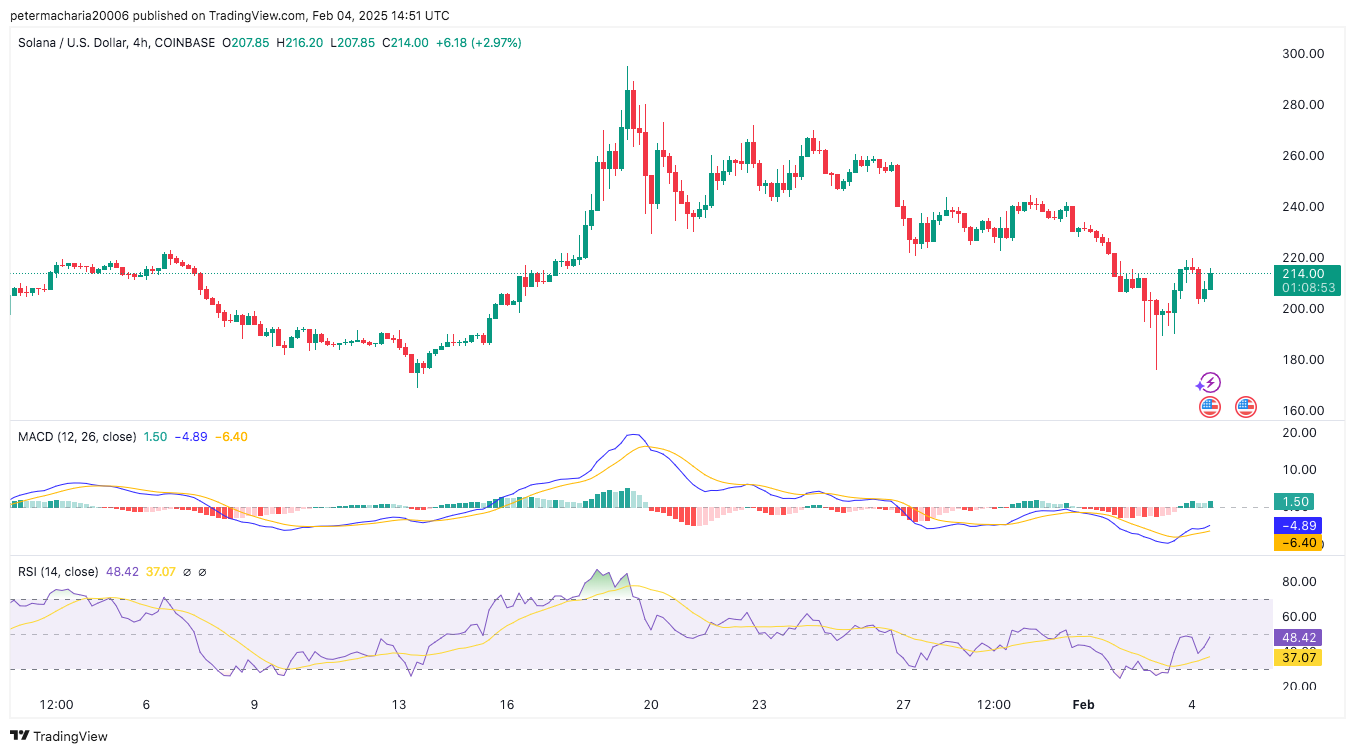
Current RSI value of 48.42 is slightly above neutral mark of 50, suggesting a balanced market. Neither is the price overbought nor oversold, creating some kind of equilibrium. Rise of the RSI above 50 could confirm further bullish momentum, a dip below could signal even more selling pressure.


