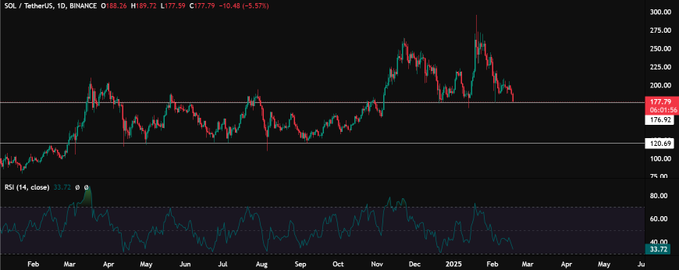
Solana (SOL) is currently testing a critical support level of $177, a historically high price point for the token. If maintained, this support level could offer a possible reversal, but if it fails, further downside risk remains.
The coin has been in a corrective phase since reaching highs above $250 in late 2022, and traders are watching closely to see if Solana can stabilize at its current price point.
Key levels to watch
The $177 support level remains crucial for Solana’s near-term price action. If this level holds, there may be a chance for the asset to recover and push towards the $200 range. However, if the price falls below this level, the downtrend could continue, signaling a need for caution among traders and investors.
Solana’s recent price decline, coupled with the increase in trading volume, points to a volatile market condition. Investors should remain vigilant, closely monitoring both the price level and technical indicators to assess potential entry points or confirm a trend reversal.
As of the latest data, Solana is trading at $178.07, reflecting a 5.82% decline over the past 24 hours. Despite the drop in price, Solana’s market cap stands at $86.97 billion, with a 24-hour trading volume of $4.5 billion, showing a significant 107.98% increase in activity. Despite the downward price movement, this surge in trading volume signals heightened interest and potential volatility in the market.
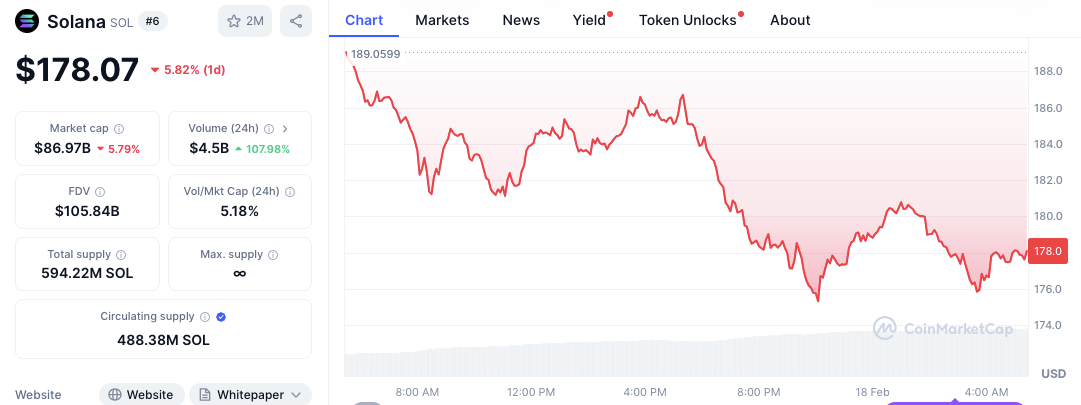
The fully diluted valuation (FDV) of Solana is estimated to be $105.84 billion. The total supply of SOL tokens is 594.22 million, of which 488.38 million are currently in circulation. These figures suggest a relatively large supply of Solana circulating in the market, which could impact future price movements as market conditions evolve.
Solana technical indicators and analysis: MACD and RSI
Solana’s daily chart shows a significant downward trend, with the price hovering near the $177 support. The Relative Strength Index (RSI), a momentum indicator, stands at 33.95, signaling that the asset is approaching oversold territory. Although a value below 30 is typically considered oversold and suggests a potential reversal, the RSI still leaves room for further downside, indicating caution for investors.
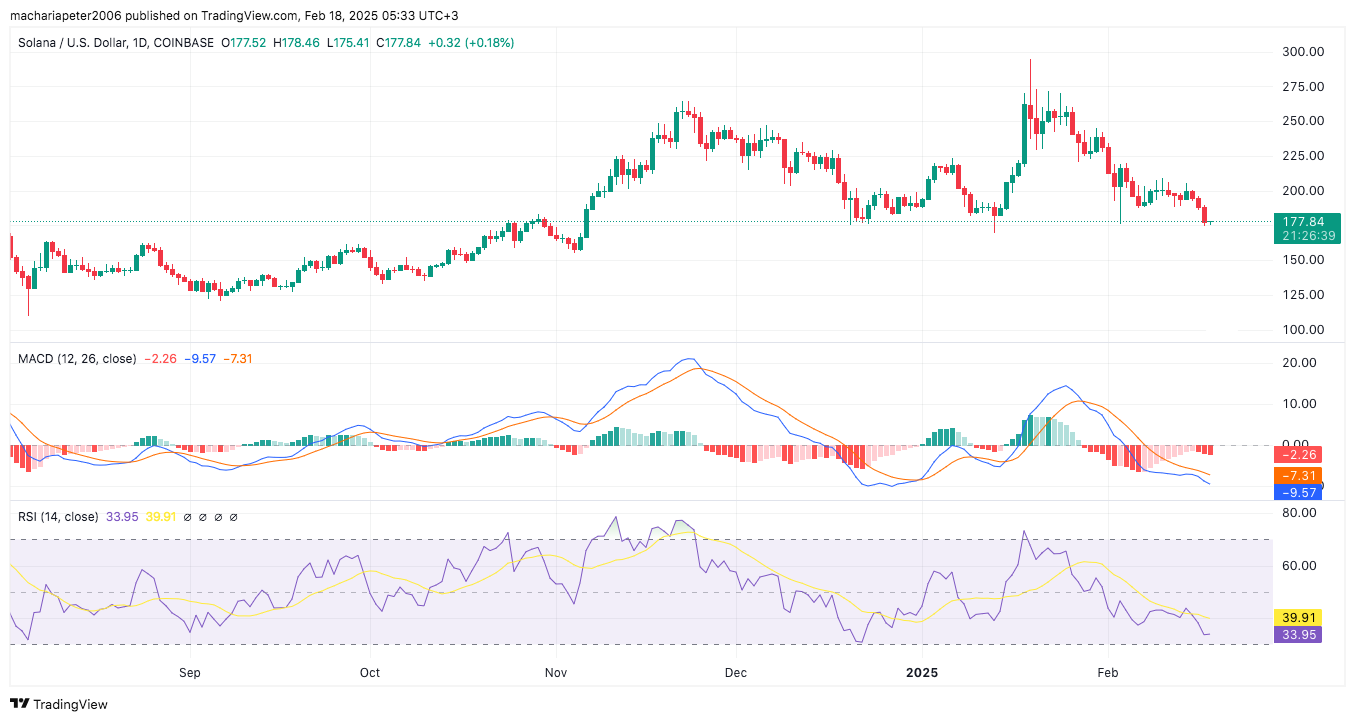
Furthermore, the Moving Average Convergence Divergence (MACD) further adds to the bearish trend, as the MACD line of -2.26 and signal line at -9.57 stand for a negative difference of -7.31. Therefore, this is confirmation of bearish pressure in the market; until the price shows the signs of reversing the prices can still go down further.


