
Somnia (SOMI) is showing a sharp recovery, climbing almost 32.35% in the past 24 hours. The token is now priced at $0.5245 with trading volume spiking to $296 million, a jump of nearly 74.93% over the same period.
Its market capitalization stands at $84.17 million. Despite this strong surge, the broader weekly performance remains negative with a decline of 23.7%, highlighting ongoing volatility in the asset.
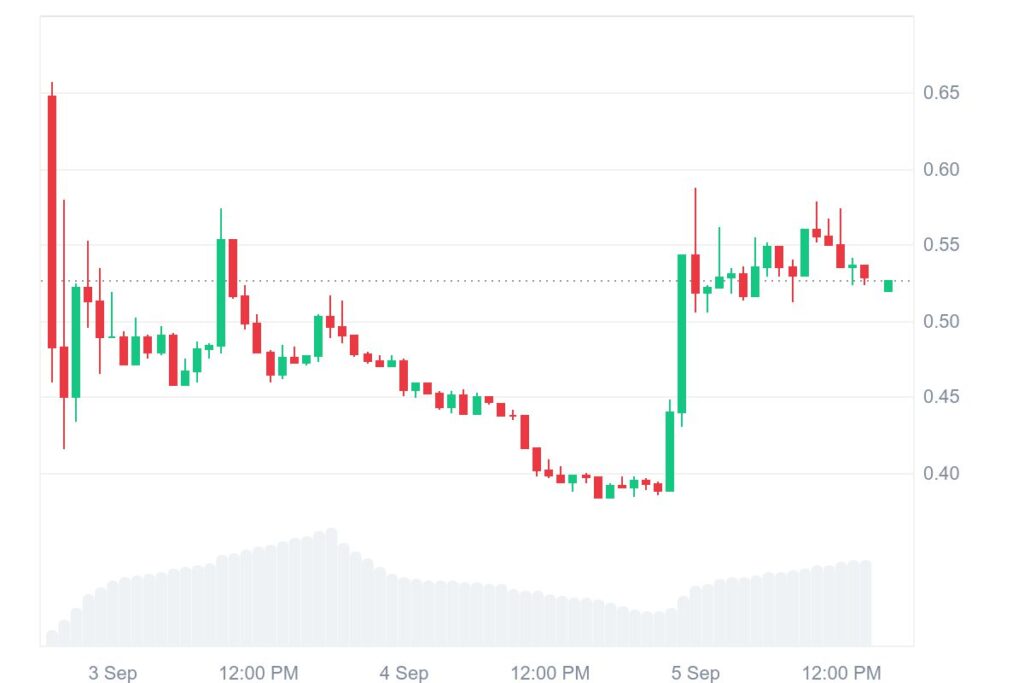
The quick rebound suggests renewed investor interest, supported by higher liquidity. However, the weekly losses emphasize that sentiment is still fragile. This mix of recovery and prior weakness positions SOMI in a neutral-to-cautiously bullish zone for now.
SOMI technical indicators signal mixed momentum
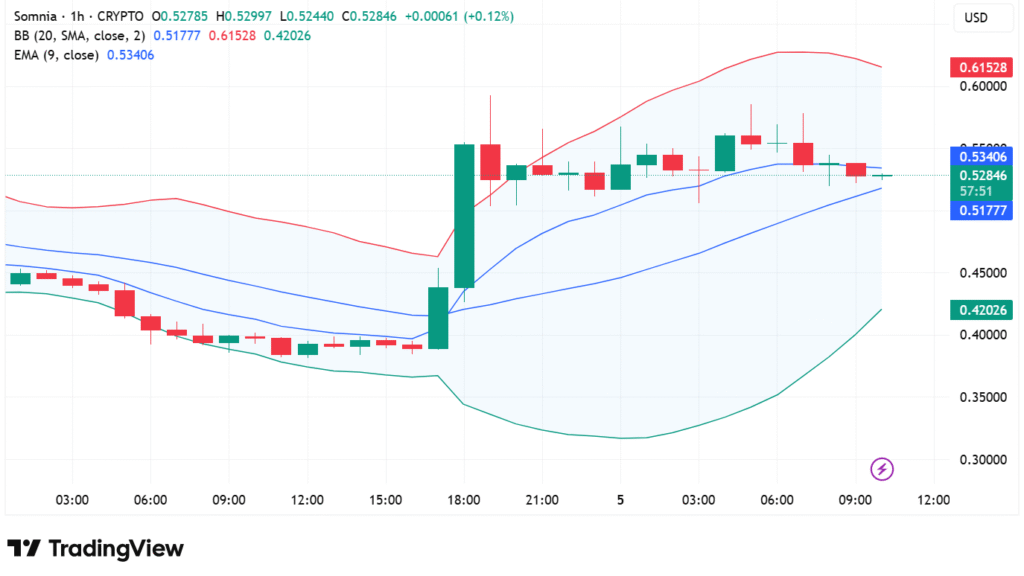
On the one-hour chart, SOMI established a bullish reversal and further consolidation. A strong candlestick at 18:00 served to push the price beyond the EMA 9 and the mid-Bollinger Band (SMA 20). The coin has, thereafter, been fluctuating between $0.52 and $0.55, showing market indecision since then.
Currently, SOMI is trading at $0.5271, just shy of the EMA 9 level of $0.5340, which suggests a temporary dip in momentum. Having widened on the breakout, the Bollinger Bands have started to tighten, which suggests diminished volatility.
The SMA 20 level of $0.5177 remains a key support level, and resistance levels are at $0.5340–$0.5380 and stronger at $0.55–$0.56.A crossover above these may put the price on track to the $0.6152 level, and a fall below the SMA will diminish the tone to bearish.
Indicators suggest caution for traders
Momentum indicators show short-term preliminary weakness. The RSI has declined to 55.65 after emerging from the overbought region, which shows fading bullish pressure. The MACD line crossed the signal line on the underside, with the histogram turning negative at -0.00204, which reflects growing pressure from the sellers.
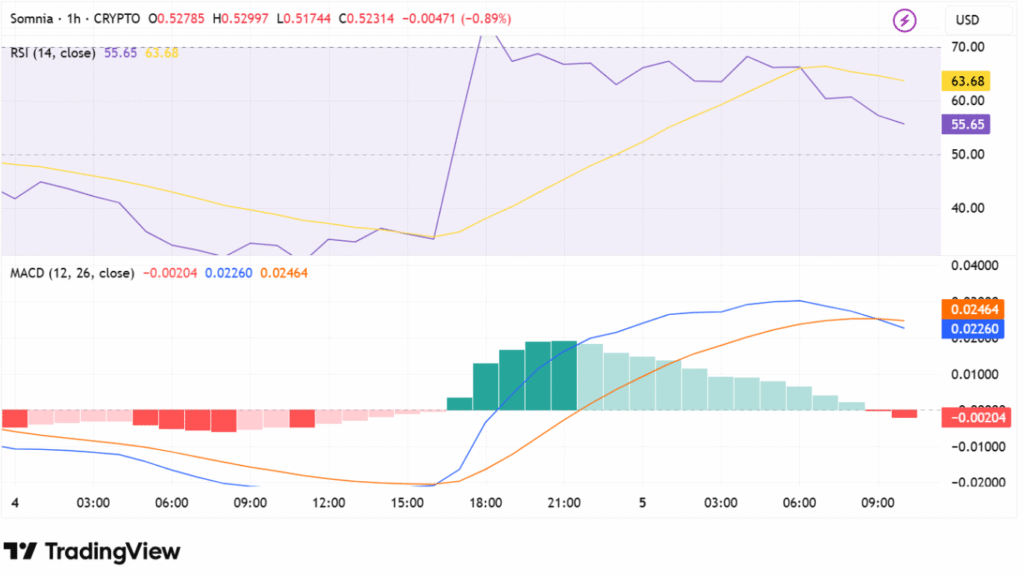
If SOMI fails to stay above $0.515, then more selling might develop. For the moment, the broader outlook is neutral to mildly bullish. Traders can wait and watch the next obvious move above the EMA or below the SMA before entering into new positions.