Stellar (XLM) is currently at a pivotal point in its price action, showing the potential for a breakout despite ongoing consolidation. The cryptocurrency has been trading within a narrow range, and technical indicators suggest a critical decision is approaching. The battle for the $0.39 support level will play a decisive role in determining the next phase of price action, with crucial resistance and support levels marking the path ahead.
The price structure on the daily chart for Stellar (XLM) has formed a classic setup with clearly defined resistance and support zones. The key level to monitor is the $0.39 mark, which acts as an important support zone.
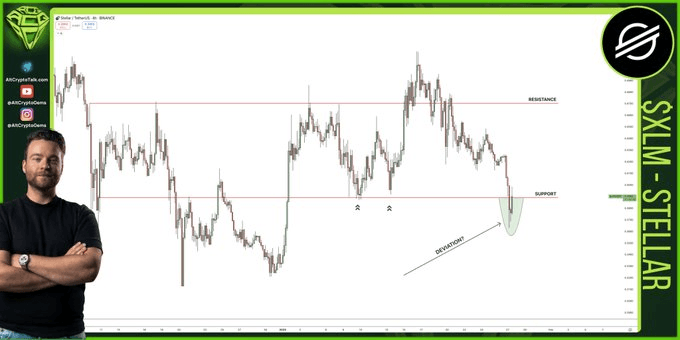
If the price holds above this level, it will likely signal that the current downtrend is a deviation, paving the way for a potential rise. However, should the price break below $0.39, the trend could resume its downward momentum, with further declines possible.
The chart also shows an ascending trendline, providing additional context for potential lower-level support. This suggests that the market may seek buying interest if the price moves closer to the trendline, further emphasizing the importance of the $0.39 level for the short-term outlook.
Liquidations highlight market volatility
Recent liquidation data for XLM showed the market’s volatility, particularly during December. On December 9, a sell-off triggered long position liquidations, while the end of the year saw a shift in sentiment, with short positions caught off guard as the price rallied.
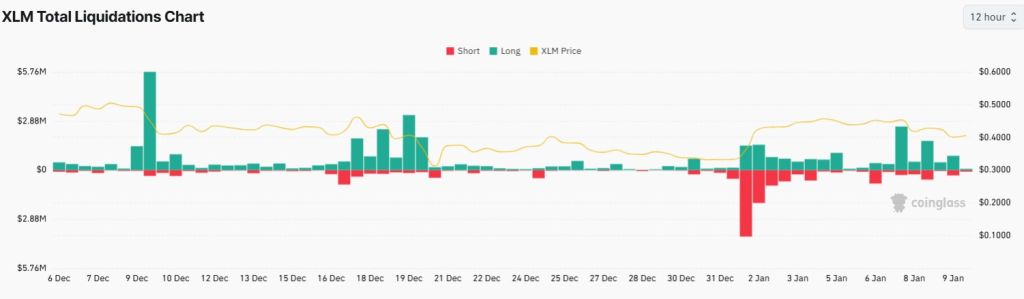
Although liquidation activity moderated in January, brief spikes continue to occur as the price fluctuates. This volatility reminds us of the risks associated with high-leverage trading, as sudden shifts in price can quickly trigger liquidations.
Market sentiment: Funding rates and bullish bias
CoinGlass data shows that XLM’s funding rates have largely been positive since late November, indicating a bullish bias in the derivatives market. The largest spikes in funding rates occurred during early December rallies, reflecting the strength of long positions.
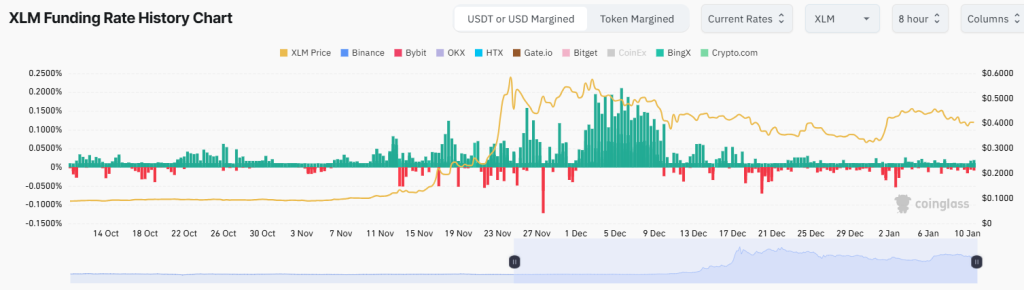
However, the fluctuations in funding rates, especially in January, suggest a balance between bullish and bearish sentiment. Traders must be aware of these shifts, as high funding rates can lead to unsustainable upward pressure, increasing the risk of a correction.
Bollinger Bands and MACD analysis: What to watch
The Bollinger Bands show increased volatility as they expand, indicating that XLM’s price is nearing overbought conditions. The price is trading near the upper band at $0.4374, a typical indication of an overextended market.
When the price reaches the upper band, it can signal that the asset may be overbought and that a pullback or correction might be imminent. If the price fails to sustain above the upper band, we may see a move toward the middle band at $0.4089 or even the lower band around $0.3803, which provides support.
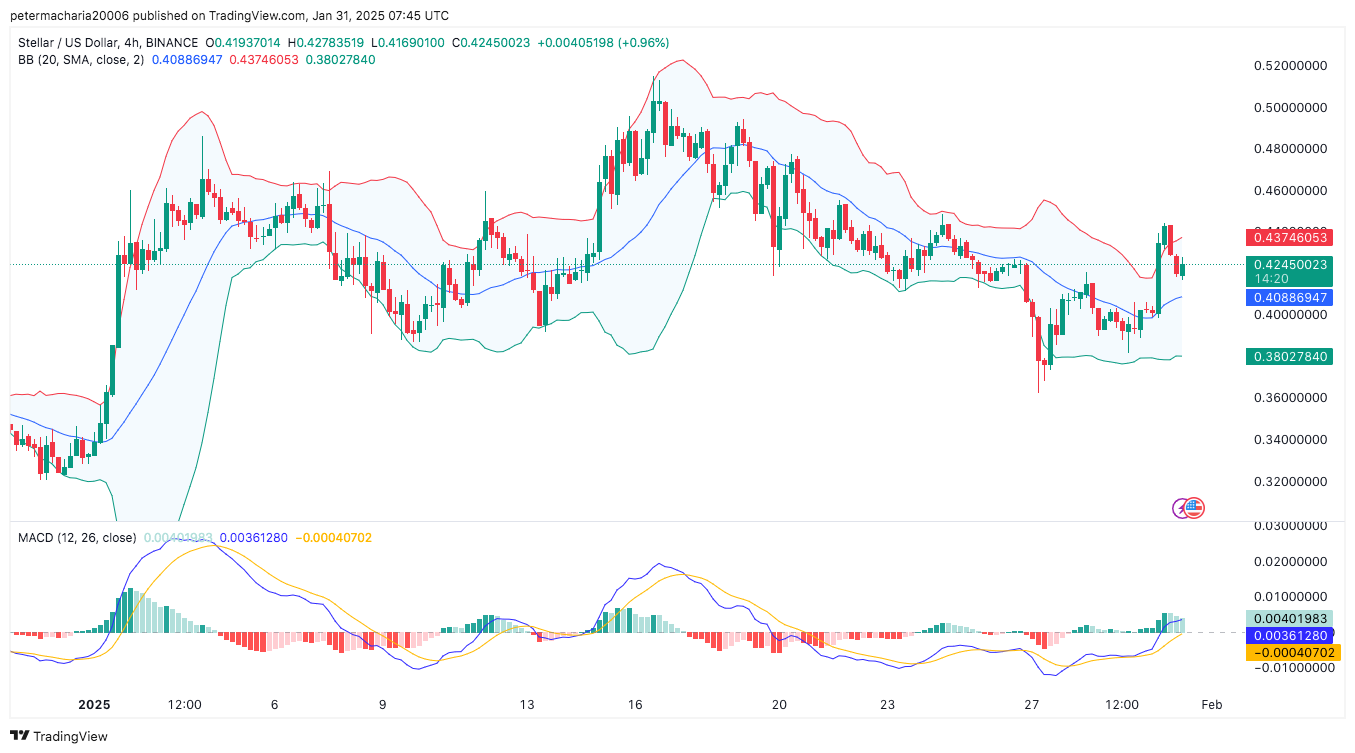
The MACD (Moving Average Convergence Divergence) also suggests that the major market sentiment is bullish. It is clear from Fig 2 that the MACD line is above the signal line which is an indication of positive momentum. This is in the positive territory and the histograms portray the difference between the two lines moving up thus supporting the conclusion.