
Toncoin (TON) has shown impressive upward momentum since Nov. 2024, with technical indicators signaling continued strength in the market. With a price surge of 4.61% in the last 24 hours and its market cap reaching $12.96 billion, Toncoin’s current performance indicates a bullish trend.
Toncoin has broken a bearish structure in the past few weeks, suggesting a change in market sentiment. A key area of focus for investors is long-term support, which has held strong during past market fluctuations. This level of stability is crucial, as it is the foundation for future price movements.
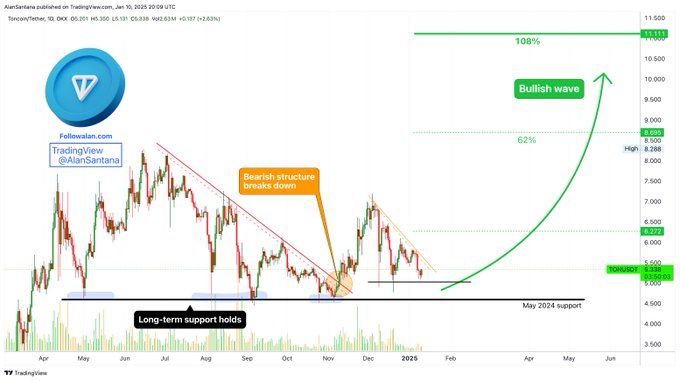
Based on the current analysis, Toncoin is poised for a potential bullish wave. Predictions suggest a possible price increase of up to 108%, with a target of $11.50 by mid-2025. Currently priced around $6.00, the digital asset is expected to see substantial gains in the upcoming months. If the support level from May 2024 holds, the token could have an upside.
Market data and fundamentals
At the time of writing, Toncoin’s price stands at $5.21, reflecting a positive 24-hour price increase of 4.61%. While this uptick is promising, it comes amid a 29.76% decrease in trading volume, signaling reduced market activity despite the positive price movement.
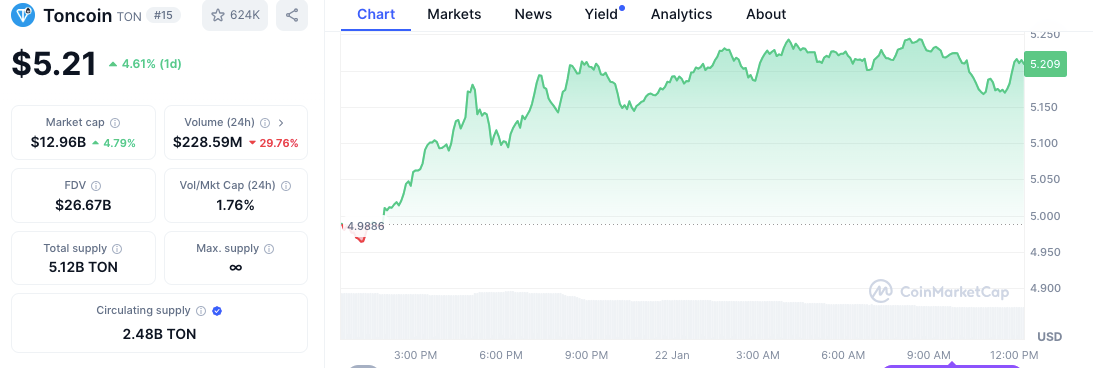
Toncoin’s circulating supply is 2.48 billion TON, with a total supply of 5.12 billion. The market cap is $12.96 billion, and the fully diluted valuation (FDV) stands at $26.67 billion, which indicates the potential market cap if all tokens were to be circulated. The volume-to-market-cap ratio (Vol/Mkt Cap) is 1.76%, reflecting a relatively healthy trading volume in proportion to its market cap.
Technical indicators: RSI and MACD show bullish momentum
Traders closely monitor two critical technical indicators, the Relative Strength Index (RSI) and Moving Average Convergence Divergence (MACD), to gauge Toncoin’s price momentum.
As of Jan. 22, 2025, the RSI is at 59.28, indicating that Toncoin is nearing an overbought condition, although it hasn’t yet reached the 70-mark typically considered overbought. This suggests that while the token remains bullish, it could face short-term resistance before continuing its upward trajectory.
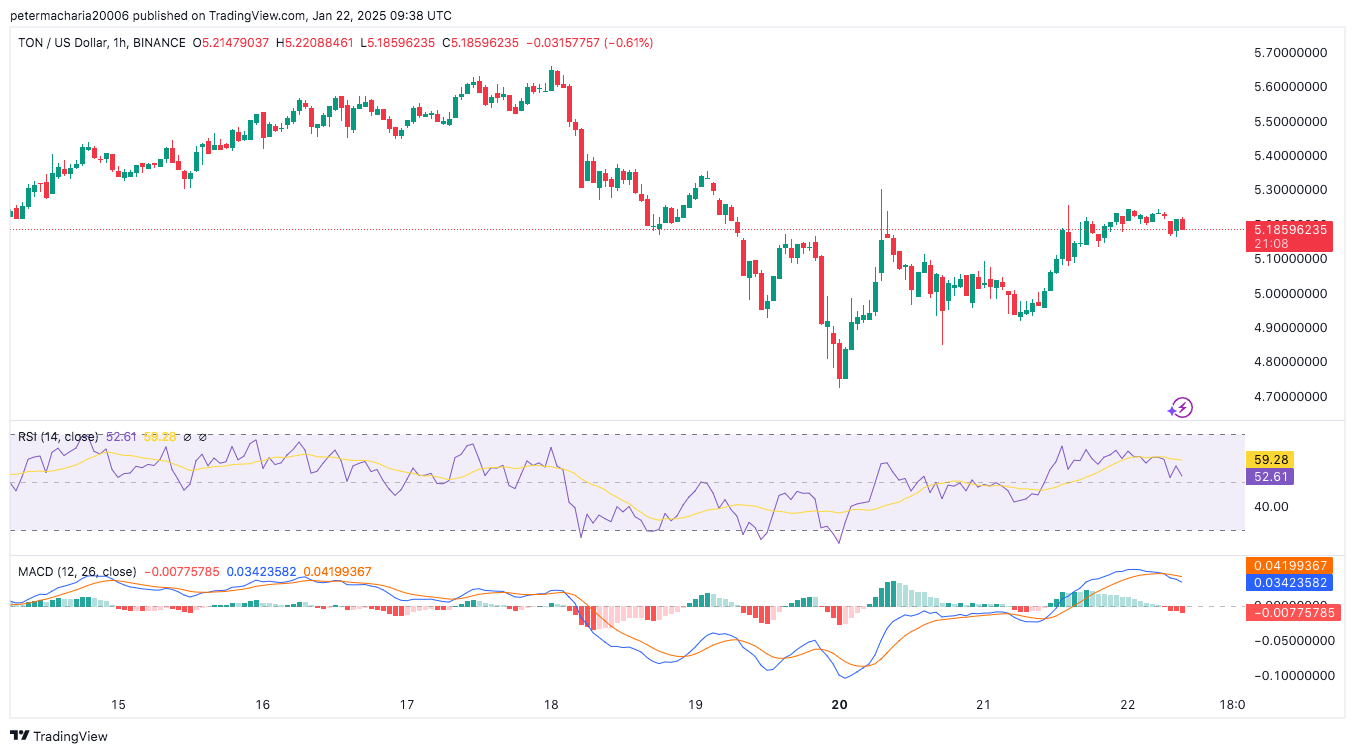
The MACD indicator detects rising trading activity trends. The market is showing upward momentum because the MACD blue line stands above the signal line orange, while histogram bars display their green color. MACD metric stands at 0.04199367, demonstrating a rising bull market direction. Due to declining histogram bars, we must approach buying or expanding exposure with prudence.


