
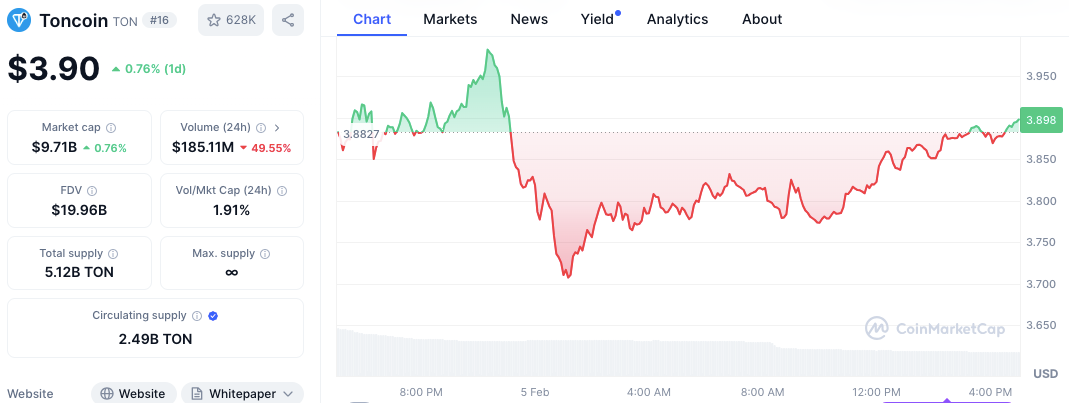
Toncoin (TON) has shown impressive potential for price growth in the coming months. After a consolidation period, technical indicators signal the possibility of a strong, bullish move. As of press time, the asset was trading at $3.90, with support levels being maintained; Toncoin could be poised for a surge, targeting a 300% increase, settling at $12.
Toncoin’s price is currently moving within an ascending channel, a pattern observed over the past year. The “Channel Up” formation shows the cryptocurrency has consistently made higher lows, indicating sustained bullish pressure.
Moreover, the chart shows a clear upward trend, with price dips finding support near the trend line. The recent bounce from this support level suggests that the bullish trend may continue.
Looking ahead, the price target of $12 represents a +300% increase from the current level. This is based on the ongoing trend, the price action within the channel, and the expectation of continued upward movement.
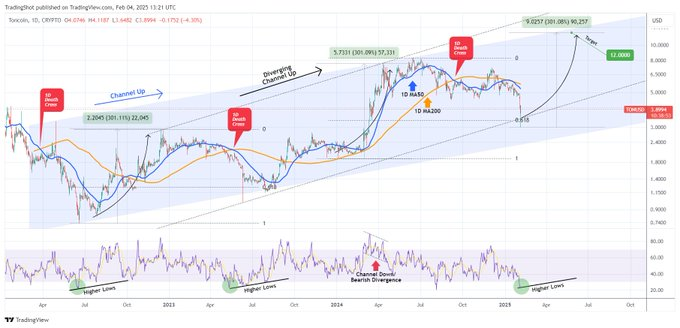
However, if Toncoin continues to respect its higher lows and breaks key resistance levels, the $12 target will soon become a viable target.
RSI and oversold conditions
The Relative Strength Index (RSI) supports a potential bullish reversal. At the time of writing, Toncoin’s RSI is in oversold territory, registering at 25.33. Typically, an RSI below 30 indicates that the asset is oversold, and a rebound is likely if the broader market conditions shift favorably. The RSI has been moving with price action, with periods of divergence suggesting that the selling pressure is weakening.
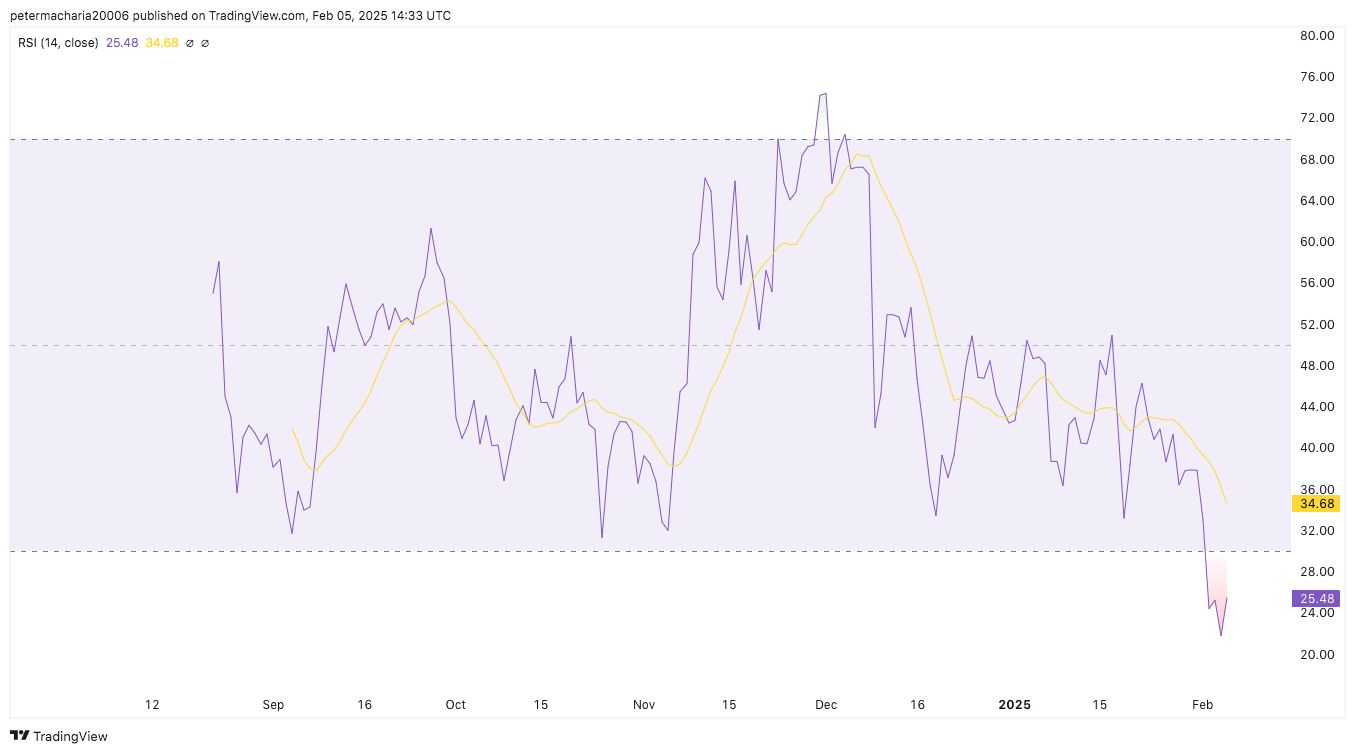
With the RSI in its current state, Toncoin could probably see a price rebound. A move above the oversold zone would confirm the onset of a new bullish leg, adding credibility to the forecasted price movement toward $12.
MACD and market momentum
The Moving Average Convergence Divergence (MACD) is another critical indicator that supports the bullish outlook for Toncoin. As of the latest chart, the MACD is below the signal line, suggesting that the market is experiencing bearish momentum.
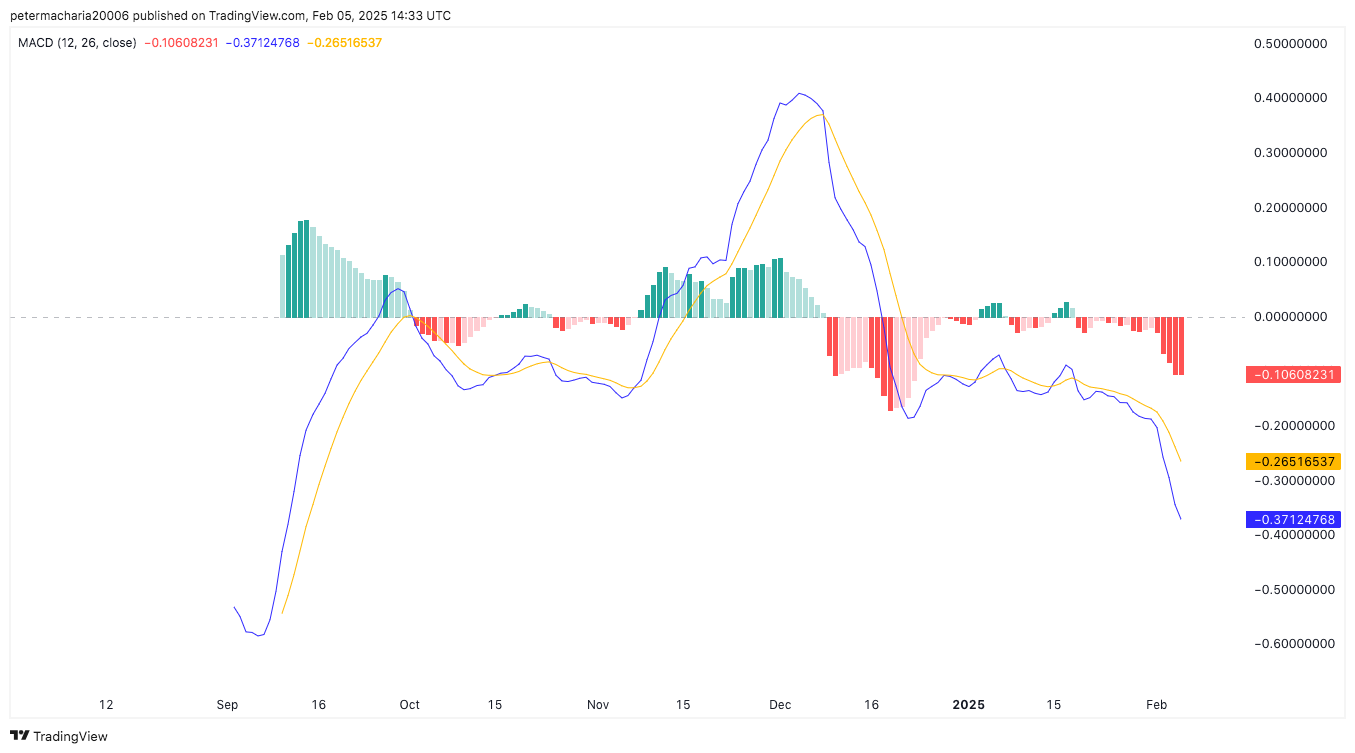
However, the negative histogram bars are going down which means that selling pressure is starting to start. A possible reversal is indicated if the MACD crosses the signal line back above the MACD lines when these narrow.