Toncoin (TON) has approached a support level at $4.515, signaling a potential turning point in its price movement. This support zone is crucial for the asset as it aligns with accumulation levels, suggesting that a bounce from this point could trigger a bullish reversal.
If Toncoin holds above this support, it might target a resistance level at $7.430 in the upcoming months, setting the stage for a possible upward trend.
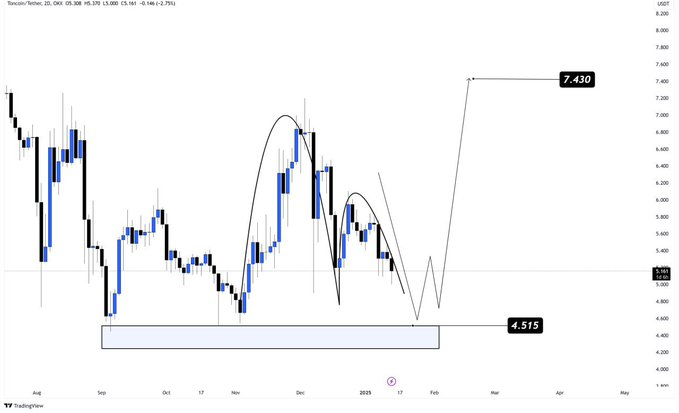
Toncoin price action and key support level at $4.515
Currently priced at $5.32, Toncoin has declined by 5.11% in the past 24 hours. The token has been trending downward from around $5.60 earlier in the day, dropping to its current value.
Despite this decline, the chart shows signs of a possible reversal if the price respects the $4.515 support level. If successfully tested and held, this zone could initiate a rally, pushing the price toward the $7.430 resistance.
Market activity and volume dynamics
Despite the recent price decline, Toncoin has experienced increased trading volume. The 24-hour volume stands at $208.23 million, a 10.77% rise, reflecting active market participation. This surge in volume could signify ongoing market uncertainty or profit-taking behavior as investors react to the price drop.
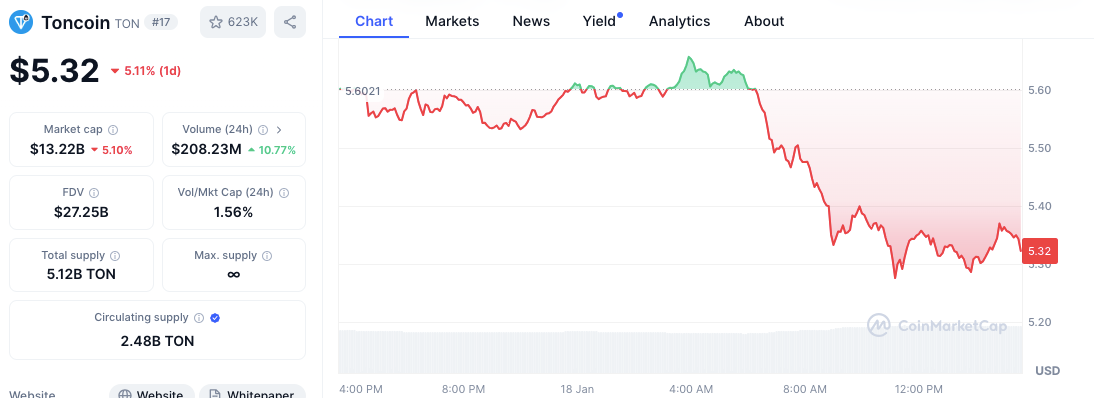
Toncoin’s market capitalization is currently $13.22 billion, a decrease of 5.10% over the past 24 hours. With a circulating supply of 2.48 billion TON, the market dynamics remain fluid, contributing to Toncoin’s liquidity and price volatility.
MACD and RSI indicators point to bearish sentiment
The technical indicators provide mixed signals. The MACD (Moving Average Convergence Divergence) is currently below the signal line, showing bearish momentum. At the time of analysis, the MACD stands at -0.0146, while the signal line is at -0.0504.
This bearish divergence suggests that the selling pressure is stronger than buying, and the downtrend could continue if the MACD remains below the signal line.

The RSI (Relative Strength Index) is at 37.54 and trending slightly below the midline of 50. Although it has not yet crossed the oversold level, a near-location to this level might signal that the Toncoin has the potential to reverse its trend. When the RSI moves lower and reaches below 30, it may wish to signal a price bounce back.