
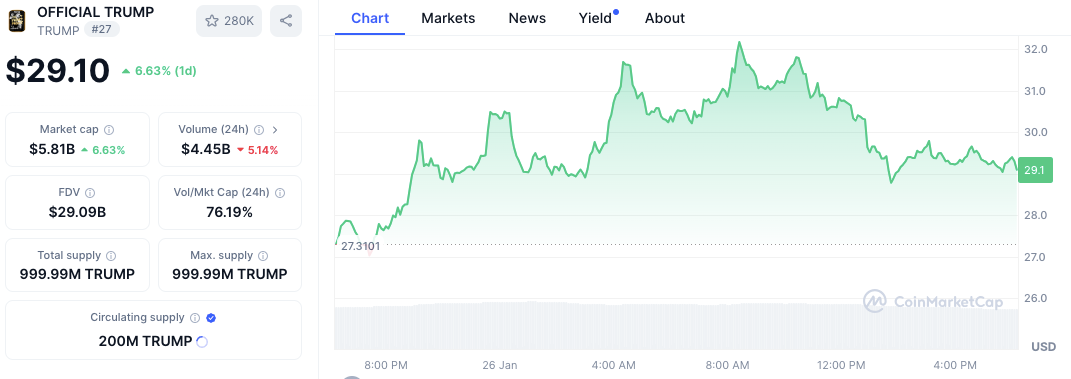
$TRUMP meme coin, launched by former U.S. President Donald Trump via his Truth Social platform, made an exceptional debut in Jan. 2025. Promoted through GetTrumpMemes.com, it experienced a price surge, reaching $75 within 24 hours.
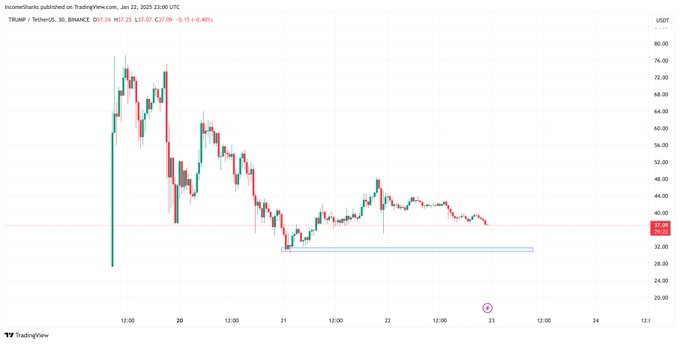
However, the hype quickly dissipated, and the token traded below $30, reflecting a dramatic reversal in its fortunes. The token’s rise was brief, with $TRUMP hitting over $70 on Jan. 20, 2025.
The surge was short-lived, with the coin experiencing a sharp decline starting on Jan. 22. By Jan. 25, it had fallen below key support levels, dropping below the $30 mark.
This sharp reversal aligned with predictions from analysts who warned of a bearish outlook after the coin failed to maintain upward momentum.
Key support levels tested
The $30 support zone was repeatedly tested throughout its decline, with the price stabilizing around this level before breaking through it. Analysts pointed to the $37.20 support level, reached on Jan. 22, as a potential zone for reversal.
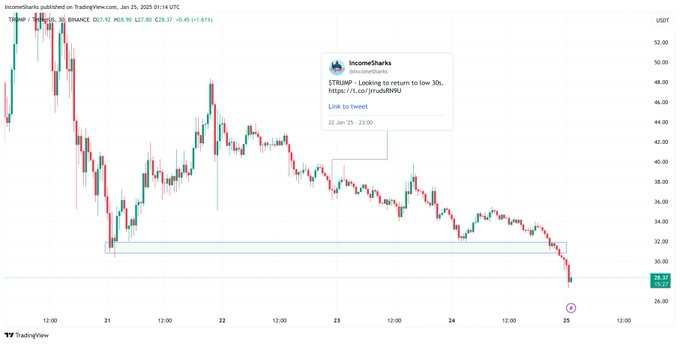
However, the price weakened, signaling a potential bearish trend continuation. IncomeSharks, a prominent figure in the crypto space, forecasted a return to the “low 30s,” further aligning with the price action seen on the charts.
Potential for a reversal at $38 support
Despite the ongoing price struggles, some analysts remain hopeful for a reversal. The price briefly touched over $70 on Jan. 20 before the rapid decline, and it has since found some support around $38.
This level has shown some resilience, with a “double bottom” pattern suggesting the possibility of a reversal if the price holds. The recent uptick of 6.63% in the token’s market cap and 24-hour trading volume suggests a recovery may be underway, though it remains uncertain.
Technical indicators: A bearish outlook
Looking at the technical indicators, the RSI (Relative Strength Index) and MACD (Moving Average Convergence Divergence) suggest that $TRUMP may face continued bearish pressure. The RSI, currently at 44.04, indicates a neutral sentiment, with neither buyers nor sellers in clear control.

The bearish momentum strengthens because the MACD line maintains a position underneath the signal line. Market indicators must change before the coin moves beyond its consolidation pattern or suffer additional price drops.