Dramatic price fluctuations are not uncommon in meme coins, and OFFICIAL TRUMP (TRUMP) is experiencing a sharp decline. Over just 15 days, the token has lost approximately $57 billion in market capitalization.
The price of TRUMP stands at $18.94, reflecting an 11.16% drop in the past 24 hours. This follows a volatile pattern, with the token’s value plummeting from its previous high of $77.24. Despite some recovery, the price continues fluctuating, raising concerns about potential instability.
Key market statistics
The market capitalization of TRUMP has dropped to $3.78 billion, showing a decrease of 11.08% within the last 24 hours. Trading volume has surged, reaching $4.51 billion, marking an increase of 16.59% in the same timeframe.
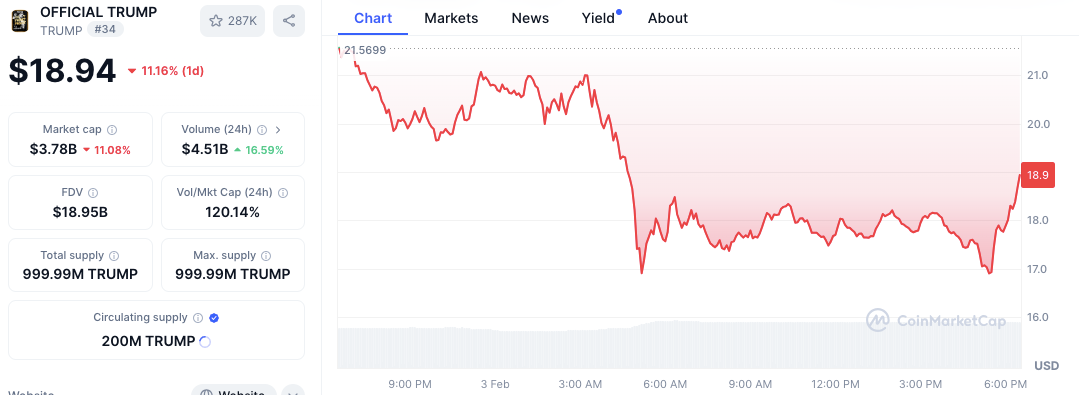
The circulating supply of $TRUMP tokens stands at 200 million out of a maximum supply of 999.99 million, with a Fully Diluted Valuation (FDV) of $18.95 billion. This shows that the token could see future growth if more tokens are released into circulation, though the current volatility raises questions about the timing and sustainability of such development.
Price volatility and market activity
The $TRUMP token has shown considerable price volatility in the last 24 hours, with a high of $25.06 and a low of $18.56, further underlining its erratic price movement. Such sharp price shifts could indicate speculative trading behavior, often seen in meme coins driven by news or rumors within the community.
The Volume-to-Market Cap ratio for TRUMP is 120.14%, which suggests that despite the overall market instability, a significant portion of the market’s trading activity is concentrated in TRUMP tokens.
Technical indicators: MACD and Bollinger Bands
A technical analysis using the MACD (Moving Average Convergence Divergence) and Bollinger Bands provides insights into potential future price movements. The MACD currently stands at 0.143, above the signal line, signaling mild bullish momentum.
However, the histogram is still small, indicating that the upward movement may not be strong. The narrowing gap between the MACD and signal lines suggests that the bullish trend could weaken or reverse soon.
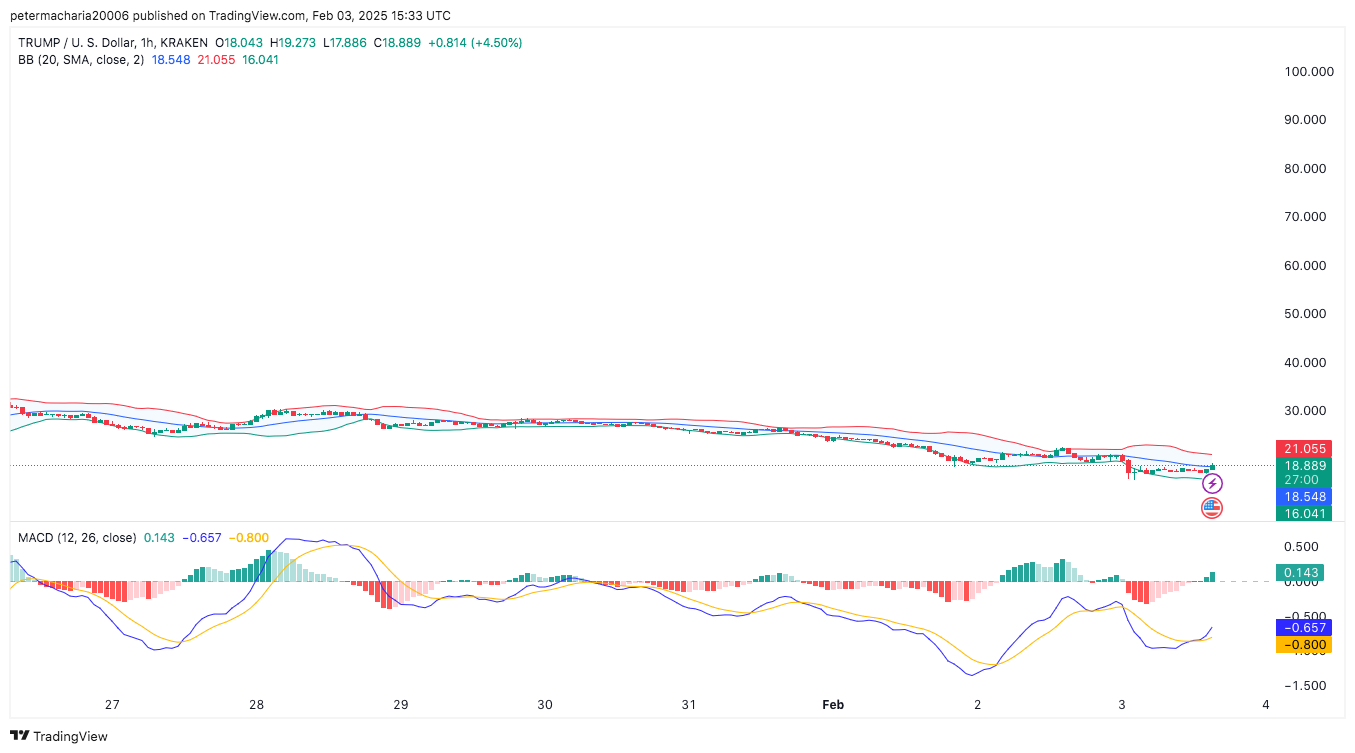
On the flip side, Bollinger Bands are extremely tight, with the price currently in the neighborhood of the lower band at $18.89. This could potentially indicate a price that is breaking out, but it is not clear whether the price is going to move up to the upper band or keep going down.


